We used to have fun commenting about the bond market, including Treasuries, Mortgages, Municipals, and Corporates. But that was before the dark times. Before deleveraging. Contact the Author: accruedint at gmail.com
Wednesday, January 28, 2009
2009 Forecast: Corporates -- Carrie!!
First, let's take one of those high-quality, non-cyclicals as an example: Johnson & Johnson. Its one of the few AAA-rated corporations left, and pharmas are about as non-cyclical as they get, so it should be a good example of "opportunities" in corporates. Here is the chart of the "spread" on a Johnson & Johnson bond maturing in 2013. The spread here is just the bond's yield less the rate on a corresponding Treasury. Higher spreads mean a greater income differential compared with credit risk-free bonds.
JNJ's spread is well off its high in November, but still much wider than its been in recent years. So yes, in spread terms it looks like a great opportunity.
But is spread the relevant measure for you? If you hedge out interest rate risk, then yes, it is. If you are a relative value portfolio manager, then yes, it is. If you are an investor who must be invested in the bond market, then yes, it is. But for a lot of investors, its a question of yield not yield spread.
So here is the graph of both yield spread and absolute yield.
Suddenly the great opportunity doesn't seem so great! The fact is that ultra-high quality corporate bonds only look attractive when compared to Treasuries and Agency bonds. For some investors who are living off their portfolio income or are legally bound to the bond market, JNJ is probably a good alternative to ridiculously low Treasury rates. But for those holding on to cash waiting for market conditions to improve, these corporate bonds are a trap.
That's because as global economics improves (thus allowing corporate bond spreads to tighten), it is likely that inflation becomes a major problem. All the stimulus currently being thrown at the economy may be the right policy for now, but it will come with an inflationary cost at some point in the future. When this happens, Treasury rates will rise rapidly. I grant that corporate bond spreads will tighten in such a scenario, but the tightening will probably be overwhelmed by the rise in Treasury rates.
Next, consider the corporate bond market generally. Right now the average yield on a corporate bond, according to Merrill Lynch's index, is 7.64%. That's off the 9%+ that was available in late October, but still, easily higher than has typically been available this decade, either in absolute or spread terms.
Of course, the devil is in the details. Take a look at this histogram of yields within the corporate bond universe, using Merrill Lynch's corporate bond master as the source. It shows the percentage of total bond issues that are currently at a given yield range.
Notice that while the average yield is 7.64%, there is a very wide range. About 1/4 of corporate bonds currently yield 6% or less. Not too exiting. While 1/4 yield 10% or more. Compare this with a similar histogram from the hey-day of corporate bond liquidity, 12/31/2005.
Back then virtually all investment-grade companies carried yields within a narrow range, meaning that it didn't make much difference which corporate bond you owned. Few investment-grade companies were seen as having imminent default risk.
Today, many companies are seen as having rapidly declining credit quality, or at least the risk that credit quality could rapidly decline. Its probable that most of the companies yielding 10% or more will still be around, paying debt service, five years from now. So yes, there are likely some great trades in this group.
But none of these companies are easy trades. Its names like Simon Property Group, International Paper, Alcoa, Macys, US Steel, that are offering the juicy yields. Companies that are right in the teeth of this recession.
So what does the corporate bond market offer? For those who want to just collect income, corporates are a much better choice than either Treasuries or Agency bonds. There are enough solid names to build a diversified portfolio. But this trade is all about the income collection, or the carry. It isn't about making a great trade.
Or its about making the right credit call at the right time. Picking the beaten up name than can recover. But in that case, it isn't an easy trade, its a gutsy call that could wind up with a big capital gain or else a large loss in bankruptcy.
(No positions in any of these companies)
Friday, January 16, 2009
Citigroup: Ward of the State
Remember when Obi Wan Kenobi lept up from that bottomless pit on Naboo and sliced Darth Maul in half? That's what comes to mind when I think about today's Citigroup news.
Citigroup's recent woes are a perfect reminder of what investors in corporate bonds and preferred stock are up against in 2009. Yes, government support is nice. But it isn't everything.
First the chart on Citigroup's credit default swaps (CDS). Higher CDS rates (also called the spread) indicate a higher price to insure against Citigroup defaulting.
We see the CDS fall drastically on October 13-14, when the Treasury initially made TARP investments in Citigroup and several other banks. The spread then rose to nearly 500bps in late November before the government made another injection into Citigroup that weekend. Once again the spread plummeted, settling in the mid to low 200's before rising in recent days. The chart doesn't show it, but today's announcement from Citigroup caused CDS to drop another 50 bps to +275.
The trading pattern is that Citi goes wider, the government steps in to help. So why worry? The Treasury is telling you that Citi is too big to fail right?
Step back and ask yourself why Citi is too big to fail. Its because of the interlocking nature of the financial markets. Its because Citi is a major counter-party to all stripes of derivatives. Its because Citi is a major market-maker in the financial markets. Etc. etc. It isn't because Citi bond holders or preferred stock holders need to be protected.
Another way to read the CDS chart above is that Citi would have been bankrupt not once, but twice if it hadn't been for government support. Now, I fully expect the government to continue to support Citigroup, but what is this new good bank/bad bank split going to look like for bond investors? Debt holders aren't likely to be backed entirely by the good bank, because that bank would be over-leveraged. Some of the debt is going to go to the bad bank. It could wind up where the bad bank does some sort of tender and re-issue, and existing bond holders turn out just fine. But we don't know that.
There was talk that Citi could be nationalized. Again, the simplistic investor is assuming this would be good for debt holders. But in a nationalization, the government would probably move to break up the bank even faster than what is currently underway. If Citi breaks into three pieces, which piece would bond holders be tied to? Before you make a guess, remember that if the government gets involved, anything can happen.
I've heard many times a recommendation to "buy what the government is supporting." But I suggest investors take an alternate but similar approach. In the bond market, buy what the government is supporting to maintain liquidity, not what the government is supporting to avoid insolvency. There is now, or may be in the near future, strong government support of several bond sectors that would be money good anyway, but are trading cheap because of poor liquidity. Student Loan-backed bonds, municipal bonds, GSE-backed mortgages, etc. Why are people buying Citigroup bonds at around 6% yield with so much uncertainty surrounding it?
Citigroup is clearly a declining situation. It may well be that with government support, Citi survives and eventually becomes a thriving company again. But its also distinctly possible that in a break-up, bond holders are left with something less than full government support. Buyer beware.
Follow-up on MBS
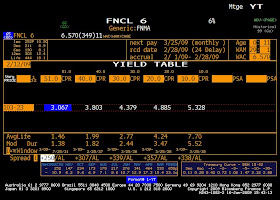
That's the basic Bloomberg screen for MBS yield analysis. The "FNCL 6" at the top indicates this is a generic Fannie Mae 30-year 6% mortgage. In the top right you can see the actual pre-payment experience. Where it says "Life 444 18.1" that means that generic Fannie Mae 6's have paid at a rate of 444 PSA or 18.1 CPR. Again, I don't want to go into the minutia how the prepayment models work, but 100 PSA is sort of a base prepayment level assuming no real refinancing incentive. 444 PSA is therefore 444% of the base speed. CPR is closer to a straight prepayment percentage. So this thing has actually paid at a rate of 18 CPR.
On the far left, near the middle you see 103-23. This indicates a dollar price of 103 and 23/32. Or 103.71875% of principal amount. Above this in the yellow boxes is the prepayment speeds which I've entered in. By default it comes up with Bloomberg's model estimates.
In the blue box below the 51 CPR speed is the yield (3.067%) assuming that speed. Then to the right of that is the yield at alternate speeds.
Near the bottom of the page is the average life at each given speed. You can see the average life at 51 CPR is 1.46 years. Note that this is how long it takes for half of principal to be returned. Not all of principal, which is a common misunderstanding.
Investors in MBS should always remember that when you type 15 CPR in for a mortgage, that's assuming a level prepayment rate. But in reality, given that interest rates will rise and fall over time, the actual prepayment experience will be lumpy. Under normal circumstances (which isn't now, for sure), I usually assume that my MBS positions will go through a prepayment spike at some point even if they are currently out of the money.
Post your questions to the comments or e-mail me.
Bank of America... Literally
- Its been floated around that the government cut some sort of deal with BofA to buy Merrill Lynch. That makes zero sense. Why would the Treasury pledge money to bail out Merrill on the same day they were refusing to help Lehman?
- What makes more sense is that the government offered BofA some help sometime in October or November to assure that the Merrill transaction was completed. In other words, once they saw how badly they had f'ed up by not bailing out Lehman. It might explain why Bank of America suddenly decided to fully guarantee Countrywide debt out of no where. That could have been part of the bargain.
- Some of the speculation about a cloak-and-dagger government deal centers around the seemingly exorbitant price Ken Lewis decided to pay for Merrill. But didn't he do the same thing with Countrywide? Bought a company that, while potentially valuable, could have obviously been had for less?
- I can't see how Ken Lewis keeps his job now. Bank of America would be in great shape had they simply not been so aggressive in acquiring CFC and MER. Compare his actions versus Jamie Dimon (Bear Stearns and WaMu) and John Stumpf (Wachovia). Both got valuable new pieces at rock-bottom prices, whereas Lewis seems to keep bidding against himself.
Thursday, January 15, 2009
2009 Forecast: Agencies and MBS -- Back door huh?
I lump agency debt and MBS together because both are basically wards of the state at this point. They are also the best example of Quantitative Easing working that we have so far.
5-year bullet GSE debt (that is, non-callable) has declined in spread from about +150 in October and November to about +80bps. It will probably get down to about +50 before stalling there. Historically agency debt traded between +20 and +40bps, but I'd say that in a lower liquidity environment, agency paper won't get that tight.
80bps ain't nothin' these days. With the 5-year Treasury now below 1.40%, one could argue that Agencies are generating 57% more income than comparable Treasury bonds. That's going to continue to attract real money buyers looking for something that's both safe and liquid.
MBS suffer from a severe negative convexity problem. MBS investors have essentially sold short an interest rate option to the underlying mortgage borrowers. Those borrowers are now almost universally in the money. Many borrowers will have difficulty actually refinancing (more on that below) but regardless, the price for MBS securities will have difficulty rising above $104 or so with an embedded in-the-money option with a $100 strike.
To see what I mean, notice the price spread across the coupon stack (using Fannie Mae 30-year MBS for February settlement):
- 4.5% Coupon: $101.938
- 5%: $102.750
- 5.5%: $103.203
- 6%: $103.656
- 6.5%: $104.500
This is the current dollar price for a mortgage security with the indicated coupon. Typically the underlying mortgages have a rate 0.5% higher than the coupon rate. Notice, for example, that the 6% bond at $103.656 is less than one point higher than the 5% at $102.75. To me that's telling you that if rates were to fall by 100bps from here (implying the 5-year Treasury is 0.40%), the 5% mortgage would only improve in price by 1 point.
All this is to say that those hoping for price appreciation out of MBS should look elsewhere. But those looking to just collect fat income may have found a home.
Say you buy a generic 6% Fannie Mae MBS at $103.656. According to Bloomberg, that bond will pay at approximately 51 CPR (if you aren't a bond person, just assume that means 51% of the loan will pay down each year, that's close enough). That produces a yield of 3.09% with an average life of 1.5 years.
That isn't half bad considering that Treasury bonds in 1.5 years are yielding about 0.40%. You have some reinvestment risk as the mortgage pays down, but by 1.5 years rates may be rising again, and so maybe that's a good time to be reinvesting anyway.
If you are willing to do a little more work, you can do much better. Say you can find a pool with mostly 2006 borrowers. Most of those borrowers have experienced negative home price appreciation to some degree (not as bad as you might think because we're only talking about conforming loans here, i.e., loans under $417,000). Anyway, couple this with a pool full of borrowers with 90+ LTV? Or mostly coastal geographics? Or relatively low credit scores? You might have a mortgage pool that will repay much slower than average.
Say you can pick a pool that pays at 40 CPR instead of 51 CPR. That increases your yield to 3.82%. 30 CPR? Now its 4.39% wih a 2.8 year average life. That compares very favorably with the 3-year Treasury trading at 1%!
Finding these kinds of pools is somewhat easier in hybrid-ARMs, which I love here on a pure relative value trade. But beware, the liquidity is much weaker in this sector. Otherwise I'd be a bigger overweight in hybrids than I already am. You can also get a lot of good high LTV loans in the GNMA space.
So if you are going to just buy and hold and don't care about keeping up with Treasuries in a rally, MBS are probably as good an investment as any. But I'm underweight MBS, focused entirely on the kinds of specialized pools that I described above. I've basically dumped all my 5.5% and lower bonds.
So to make a prediction about the sector, I'd say the the Fed's continued support will keep dollar prices relatively high, even if Treasury rates back off a bit. But overall I expect MBS spreads will perform extremely poorly should rates fall from here, and that has me cautious on the sector. I'd add heavily to MBS if the 5-year broke 1% or the 10-year broke 1.6%.
Callable agencies are kind of the worst of all worlds. There is no value-adding opportunities through pool selection akin to what can be done with MBS. And you have the same negative convexity problems, where if rates fall you get called away and if rates rise you get crushed. So I'd avoid most callable agency issues.
Clumsy and Random Thoughts
- Bank of America is getting Treasury help to ensure finalization of Merrill Lynch deal. This really proves that the administration regrets letting Lehman go.
- Speaking of Bank of America/Merrill Lynch, aren't they essentially reconstructing exactly what Citigroup is trying to decontruct? Is it the model that doesn't work, or is it that Citigroup isn't managing their business? Is it the model that doesn't work, or is it that Citigroup was the pioneer of SIV and a leader in ABS CDO underwriting?
- Treasury market is going to explore its lows in yield, maybe not today, maybe not tomorrow, but soon.
Monday, January 12, 2009
Citigroup: Now the bank is all but extinct
We know, or at least think we know the following.
- Citi isn't desperate for capital. They just got a huge chunk from us taxpayers.
- They aren't getting much cash in this deal, reportedly less than $3 billion. A pittance in the scheme of Citigroup.
- This doesn't unload any troubled assets.
- Smith Barney is a reliable earnings producer.
Selling Smith Barney doesn't solve any of their problems. It neither raises any capital to speak of, nor does it unload bad assets. And why sell now? Supposedly they are going to book some $10 billion in gains on the sale, but so what? No one is fooled into thinking that's real capital right? Valuation on the brokerage unit is got to be at all-time lows!
In fact, by selling Smith Barney, Citi is giving away deposits. Many Smith Barney clients use Citibank deposit accounts as a sweep vehicle. I haven't seen numbers on this, but a friend of mine who works confirms this is very common.
Citigroup isn't doing this to focus on its classic banking division, because Citi has been more of a investment and commercial bank than a retail bank for at least 15 years. This would be reversing a generation's worth of "progress" toward transforming Citibank. Citi doesn't have the branch network to suddenly become a serious competitor with Bank of America or Wells Fargo.
But it all starts to make sense if you assume that the rest of Citi is also for sale. Say the buyer is Goldman Sachs, who doesn't want Smith Barney's 14,000 brokers or their back office or their compliance headaches, etc. Goldman just wants the big fat bank and its deposit base to give them secure funding. To me I'd rather see Goldman buy up smaller banks with less baggage, but maybe Goldman expects some government help?
I just have the feeling there is more going on here than just Smith Barney.
Time for Tips
First, take a look at the TIPS "Breakeven" curve. This is simply the nominal yield on a TIPS minus the yield on a traditional Treasury bond with approximately the same maturity. One can infer that this is the "priced in" inflation rate over a given period. All are quoted as of January 9.
5-years: -0.40%
10-years: 0.55%
20-years: 0.103%
30-years: 1.23%
Roughly speaking, if actual CPI comes in higher than those breakeven numbers, the TIPS will outperform the Treasury. If CPI is lower, then the Treasury outperforms.
Might the CPI decline by 0.40% per year for the next 5 years? Or rise by a meager 0.55% for the next 10? Consider the Fed's current tactics.
- Cut the Fed Funds target to basically zero
- Agreed to buy $500 billion in agency MBS
- Agreed to buy $100 billion in GSE debt
- Have or will extend funding to asset-backed securities, commercial paper, among other securities
- Promised to "employ all available tools to promote the resumption of sustainable economic growth and to preserve price stability."
In a deflationary environment, printing money is the right policy. Had Japan followed a similar path, their generation-long malaise may have been shorter and less severe. But regardless of whether its the right policy, printing money is a highly inexact tool. The Fed will undoubtedly err on the side of creating too much money, as deflation is a much bigger threat. But given this, it is extremely likely that the Fed will wind up creating too much money, and thus create price inflation. To suggest that over a 10-year period, inflation will average zero is to suggest that the Fed will create just enough money to offset the private sector slowdown. That is giving the Fed way too much credit.
The best play here is in longer TIPS, at least 10-years. Short-term, CPI might print very low indeed, which results in a lower realized coupon for the investor. But over the course of the next 3-6 months, the market will start to realize that deflation is going to be a 1 or 2 year phenomenon, followed by a period of elevated inflation. So there is a chance that over 5-years, inflation is (on average) pretty low, but over longer periods, inflation protection will garner a premium.
Long time readers will remember that I've panned TIPS in the past as a quasi-commodity play. I haven't changed that opinion generally, but now I think its clear that both commodities and core inflation should be rising rapidly from here, at least to where final CPI is in the 3's and probably the 4's, with upside much higher.
There are several TIPS funds, including iShares Barclays TIPS Bond (ticker is TIP) and the Western Asset Inflation Management Fund (IMF).
One warning is to beware of the correlation between TIPS and other bets you might have. I mentioned commodities already, but currency plays too might be highly correlated with a TIPS trade.
Disclosure: Long TIPS directly, do not own any TIPS funds.
Friday, January 09, 2009
2009 Forecast Episode II: Deflation Strikes Back
The question on many lips is are Treasury bonds a bubble? I've already said that fighting deflation will be the major theme of 2009. Deflation will remain the primary concern of the Fed until housing prices start to recover. I don't see that happening until 2010. Until housing prices start to rise, we'll see persistently poor final consumer demand. This in turn keeps the velocity of money low and thus the money supply contracting.
I have a very simplistic mental model for Treasury rates. Real interest rates should reflect the opportunity cost of money. Thus a short-term Treasury rate should be the opportunity cost plus an inflation premium. Longer-term rates should reflect both opportunity cost, inflation, and a term premium. When economic growth is weak, opportunities are less, and thus interest rates should fall.
If we have negative inflation, then short-term Treasury rates should be extremely low. Near zero makes sense for T-Bills (although negative yields is questionable at best). Less than 1% makes sense for the 2-year. So I see no bubble on the front end of the Treasury curve. Not that there is a ton of upside on the 2-year at 0.75%, but could it go to 0.50%? Sure.
Longer Treasury bonds are the better bubble candidates. One might be able to argue that in the short term, both growth and inflation will be negative, thus the equilibrium nominal short-term rate should probably be negative. But longer term, we'll eventually have both growth and inflation, and thus long-term Treasuries should not be approaching Japanese-like levels.
So when the 10-year was pushing 2%, it felt bubbly. But still I resist the bubble label. To me, Treasury rates are clearly below "fair value" but given the extreme liquidity and economic circumstances, I doubt the 10-year can move above 3% until at least 4Q 2009. I think long-term Treasuries remain over-valued until its obvious that inflation is going to eventually become a problem.
What about Treasury supply you ask? Won't the massive debt load eventually push rates much higher? While acknowledging that supply is an obvious negative for prices always and everywhere, as it is, Treasury supply is clearly not overwhelming demand. The 3-year and 10-year auctions from last week went quite well.
Besides the theory that government debt crowds out private investment doesn't hold water right now. Private lending ain't happening in areas where the government isn't subsidizing. In essence, the Treasury is leveraging because the private sector can't.
Eventually, the Fed's programs will result in much higher inflation, and thus Treasury rates will rise substantially. But I think this is a year or more away, too far away to recommend a short.
The problem for real money investors is that Treasury yields are so low, that you pretty much have to own something else. The yield advantage on short-term Agencies versus short-term Treasuries is so large that there isn't any logical scenario where the Treasury outperforms. Therefore I'm playing this by remaining underweight Treasury bonds, but owning stuff that can appreciate if Treasury rates fall. This includes bullet agencies, and some very high quality corporates.
Friday, January 02, 2009
2009 Forecast: That bad huh?
Now its just the opposite. The fundamental outlook is piss poor, but the valuations look extremely cheap across all risk sectors.
Risk assets are pricing in Armageddon. As long as no one spies any horsemen running around, those risk assets ought to pay off well for investors in the very long term. But that's the real trick isn't it? When to jump in?
I think the key to bond investing in 2009 is two fold.
1) Protect your liquidity. Professional investors, whether leveraged or not, never know when their clients will need cash. And the cost of turning bonds into cash has never been higher than now. Non-pros tend to underestimate the probability of needing cash, and frankly, non-pros don't have as many resources for producing liquidity in bonds. No offense, but its true.
I believe that liquidity has probably bottomed, or put another way, that liquidity won't get any worse than it is now. But when I say probably I mean like 65%. There is still a decent chance of another blow-up causing another spate of deep illiquidity.
That being said, bid/ask levels are going to remain very wide, probably for the next several years. We've seen improved liquidity in high-quality sectors, like agencies and munis, but even there, I expect liquidity to wax and wane with buyer demand. Remember that dealers used to be the guardians of liquidity. That's gone and it ain't coming back.
2) Buy what you can hold. This isn't to say you can't put money into a bond as a trade, but given how wide bid/ask is, and given that you don't know when bids are going to suddenly disappear, you can't assume you can flip a position. So when buying a bond, ask yourself: would I hold this bond for the next year? Two years? To maturity? Is this credit strong enough that, if I had to, I'd hold this bond indefinitely?
I argue that you shouldn't buy anything in 2009 where you can't answer that question with a confident yes.
So with all that being said, here is my basic economic forecast for 2009. I'll follow this post up with thoughts on some of the major bond sectors. As always, I'll discuss a most likely scenario along with a less likely but possible scenario.
Growth
Most Likely: Sharply negative real growth in 4Q 2008, continuing (at a less severe pace) at least through 1H 2009. 2H 2009 likely near zero. Meaningful recovery doesn't start until 2Q 2010.
Less Likely: Government fumbles stimulus, and growth is negative through 2010 and possibly into 2011, with a deeper trough.
I think the immediate period after the Lehman/AIG/GSE/WaMu/Wachovia failures resulted in a massive pull back in economic activity. We saw it in Existing Home Sales in October/November, in auto sales activity, bank lending, everything.
That took what was already going to be a recession and turned it into something much worse. I had thought that mortgage foreclosures could bottom in mid-2009, because that seemed like long enough for the bad loans to burn out. But the sharp contraction in 4Q 2008 will result in much higher unemployment, I suspect around 10% by the end of 2009, and thus the foreclosure party will continue on.
And it will take a slowdown in foreclosures for housing prices to bottom. I suspect it will be government intervention that is the catalyst for this. We've already seen the government move to lower mortgage rates, which really should give us pretty good affordability. And while part of the initial problem with housing was over-building, but that ship has sailed. Housing starts have plummeted, and now all starts are pretty much multi-family or made to order.
Anyway, you need demand to outstrip supply in order for prices to start rising. As long as foreclosures are rising, that means supply is rising. Demand is going to be tepid until the employment picture improves. Rising supply and unchanged demand equals falling prices.
So I see home prices falling throughout 2009, absent direct government intervention either buying foreclosed properties or subsidizing banks to prevent foreclosures. Obama & Co. may actually take these steps, but I'd say it'll take several months for such a thing to pass Congress, then several more months to actually be implemented. So we're still looking at late 2009 at best.
GDP growth will probably be worst in 4Q 2008, then more modestly negative in 1Q and 2Q 2009. Beyond that is difficult to say. My base case is for 2H 2009 to be about zero real GDP growth, with a meaningful but tepid recovery in beginning in 2Q 2010.
The risk to this forecast is that the government bungles the bailout attempts, most likely by letting another financial institution fail. It currently doesn't look like that's their strategy, but then again, after Bear Stearns it didn't seem like they wanted to let another institution fail. But then came Lehman.
Another risk to this forecast is...
Inflation
Most Likely: Inflation? What inflation? The Fed will spend most of 2009 fighting deflation, although by 3Q or 4Q it will be apparent that the Fed will indeed win the battle. Headline CPI will print negative multiple times in 1H 2009, predominantly on falling food and energy prices.
Less Likely: We fall deeper into deflation, most likely because the less likely growth scenario comes to pass.
I've written a few times on deflation, which is truly the primary concern of the Fed right now. The Fed has plenty of tools to fight it, and Ben Bernanke is the right man for the job, having spent his academic life studying how the Fed blew it in the 1930's.
I don't see Japanese-style deflation taking hold, at least not for the same reasons as it took hold in Japan. The Bank of Japan maintained a ZIRP policy for many years to no avail. They still suffered from deflation. Why? Because you can't get consumer inflation without consumer spending. I argued this multiple times when energy prices were rapidly rising. Energy doesn't "create" inflation, rising money supply does.
But even in the face of rapidly rising money can't create inflation unless consumers are spending. Right now, money is contracting and consumers are pulling back. In fact, those two things are usually correlated. But in the case of Japan in the 1990's, consumers refused to spend despite massive fiscal and monetary stimulus.
But here is where I think the U.S. differs from Japan. The Japanese are fundamentally savers. Americans are fundamentally spenders.
Unemployment is going to be bad in 2009, heading toward 10%. But the other 90% of Americans will keep spending their income. Now they won't be able to spend their home equity, as in the past, but basically we're a nation of spenders. Once the American stimuli take hold, consumer spending will advance anew. That's not to mention the fact that the U.S. Fed has been far more aggressive far earlier than the BoJ ever was.
Eventually this leads to some inflation problems, probably not till 2H 2010. To suggest that the Fed will provide just enough stimulus to avoid deflation but not create a significant inflation problem down the road is ridiculous.
Key to the Fed's success is the progress on quantitative easing. The TALF is the quintessential example of QE, where the Fed targets interest rates away from overnight bank lending rates. There will be no limit as to how far the Fed goes to fight deflation. They could buy corporate bonds, municipal bonds, commercial mortgages, anything. Beware what you short!
However, if we get another big leg downward in economic growth, resulting in even tighter consumer lending conditions, then the deflation fight becomes more difficult. I'd still see the Fed eventually winning, but such an outcome would result in a much longer period of ZIRP and eventually much bigger inflation spike.
In the next couple days, I'll be discussing my investment strategy around this forecast.
Municipals Bond Defaults: Oh, switch off!
Company A:
- Is heavily exposed to residential and commercial real estate
- Has experienced an 18% decline in revenue over the last year
- Has announced massive layoffs
- However, is widely viewed as one of, if not the strongest within its industry
- CDS for Company A are currently quoted at 121bps
- Is heavily exposed to residential and commercial real estate
- Has experienced a 1% increase in revenue over the last year, although previous revenue forecasts had been for an increase of 6-8%.
- Continued economic deterioration will likely cause revenue to fall about 5% short of previous guidance in 2009
- Company executives have proposed a 1.5% price increase on their second largest revenue item to close this gap
- CDS for Company B are currently quoted around 400bps
I bring this up in response to Doug Kass' piece on "20 Surprises for 2009" and specifically #11: "State and municipal imbalances and deficits mushroom." (Actually its largely Roger Nusbaum's comment here that inspired this post.) Doug and Roger) are right. State and local governments tend to spend all they have every year. Few build up any kind of meaningful reserve during times when tax collections rise due to strong economic conditions. So when economic conditions turn, budgets become highly strained. This period is going to worse than past periods for a variety of reasons, primarily because it is hitting real estate values directly, which is a key revenue item for most local governments.
But the market is making a huge misjudgement in comparing the actual risks of large municipal issuers versus corporate issuers. Right now, the State of California CDS are trading wider than all but 28 of the 125 member Investment-Grade CDX index, indicating that most investment-grade corporations are less risky in terms of credit losses than the State of California.
Currently CDS on the Golden State trade similarly to CBS Corp, Southwest Airlines, and Rio Tinto. Yes, California is exposed to a bad economy, but the state has the power to forcibly collect revenue from its citizens! At 400bps, California CDS are wider than Carnival Cruiselines (358bps), Kohl's (293bps), Darden Restaurants (275bps) and Toll Brothers (206bps). Aren't all these companies just as exposed to weak economics? And aren't their revenue streams less diversified than America's most populous state?
Remember that the CDS should reflect the expected loss for all these companies. When a corporation goes bankrupt, debt holders usually wind up either selling off the pieces of the company for cash or becoming the new equity holders of the company in a reorganization. In bankruptcy, a firm's best asset is usually their real estate, but in today's market, commercial real estate certainly won't fetch top value in a liquidation. So corporate debt holders, generally speaking, are looking at historically weak recovery in a liquidation.
What could a municipal bankruptcy look like? Municipal debt holders would obviously not be foreclosing on the Governors Mansion. Instead, the bankrupt municipality would likely issue new debt to replace the old, defaulted debt. This might take the form of replacing existing debt at 5% with new notes with a 4% coupon. Even on a 30-year bond, an exchange of this type would only result in around a 18% present value loss. Even more benign would be to pledge a particular revenue source, such as a new sales tax, to a new debt series, then use the new debt to pay off the old debt. This is essentially what New York City did in the 1970's to avoid a default.
Note that California, like 48 other states (all but Vermont) are constitutionally required to pass a balanced budget. There is no option to just throw up their legislative hands and conclude that the citizenry won't accept more taxes. There is no option to say they'd rather pay the teachers and police than bond holders. Even if budget cuts and tax hikes become severe, governments will have no choice but to use all their resources to pay bond holders.
This isn't to gloss over the problems municipal issuers face. But it is far more likely that municipal bond holders will take losses on smaller, local issuers than states and (most) big cities. Take Vallejo, CA for example. That city of 117,000 filed for Chapter 9 in May. A small city like Vallejo is much more dependent on property taxes than larger governments, which tend to have a more diverse revenue streams. Plus smaller municipalities have less budget flexibility. Their budgets are usually dominated by education and law enforcement, where as larger issuers tend to have more fat to cut.
So here is my own surprising prediction for 2009: while municipal defaults will likely rise to a record number, losses to bond holders will still be relatively small. On top of that, muni bond holder losses will be dwarfed by those suffered in corporate debt.
(I own debt securities for J.P. Morgan and the State of California. No holdings in any of the other companies mentioned.)