The Fed's William Poole gave a talk on China today. He said the chance of a rate hike next week is 50/50, which is shockingly blunt for a Fed official. He doesn't have a vote this year, so maybe that affords him a bit more freedom to speak frankly.
Probably the best quote out of it was "science takes just so far." There is no black box. It isn't a big adding machine that spits out the "proper" funds rate. The Fed doesn't know exactly what the impact of hiking or cutting or standing still might be. Sometimes they just take their best guess.
Monday, July 31, 2006
Poole's speech unusually clear...
What a difference a weak week makes...
Thank goodness the economy sucks so much. Dow up 351 points last week, 10-years down 5bp. Everyone makes money.
Over the weekend I had a couple people tell me they get confused when they open the newspaper and read one article about an ugly economic statistic being released, then read another article about the Dow being up 100 points. Hey, if the markets weren't so complicated and confusing, we investment managers wouldn't have jobs.
It looks like we are going to have our first really questionable Fed meeting on August 8. Funds futures show a 35% chance of a hike. Here is the chart of Fed Funds futures for August, September and October over the last 30 days. The odds of a hike (to either 5.50% or 5.75% for October) are on the left axis and the 10-year rate is on the right axis.
Note despite the rally last week, the Fed Funds futures picture for September has never changed. I keep thinking that if the Fed stops at 5.50% or even 5.25%, the curve should have some slope, which means the 10-year should be higher than it is now. In order for the 10-year to be at 5%, a Fed cut has to come pretty quickly.
Poole and Yellen speak today. Some people have called Yellen a dove, but that is a relative term.

Friday, July 28, 2006
Memo to securities regulators:
To those looking into whether hedge funds are using inside knowledge, let me save you some time. They are. Does anyone really think that if a trader at a large hedge fund happened upon some juicy insider information that could help him make a 7-figure bonus, that he'd just let it drop? One of the primary things that makes someone a good trader is aggressiveness. Kill or be killed. The riskier the trading, the more aggressive a successful trader is. That kind of attitude tends to lead to walking very close to the line, and sometimes stepping over.
The Wall Street Journal article from today titled "Are Deal Makers on Wall Street Leaking Secrets?" specifically references trading in CDS before the recent LBO offer for HCA. The thing of it is that HCA being an LBO candidate wasn't exactly a big secret. In fact, the Wall Street Journal reported on July 19 that an LBO attempt for the company had collapsed, 3-days before a successful deal was announced. I will tell you that it was all over the street for weeks that HCA was a buyout candidate.
I'm not saying there was not insider trading going on, because see paragraph #1. But in this case, I'm not sure this wasn't just old fashioned good analysis.
The Road Less Traveled
Its time for some quiet, Friday morning reflection. Only when you are calm, at peace, will you know the good trades from the bad. Maybe some Robert Frost will put us in the right mood.
Two roads diverged in a wood, and I-
I took the one less traveled by,
And that has made all the difference.
Mmmm... pretty good trading advice, I'd say. A great example is in today's Wall Street Journal, "For Short Sellers of GM, a Trip to the Scrap Heap."As Gregory Zuckerman and Ian McDonald report, "At thebeginningg of this year, 17% of GM's outstanding shares were sold short, up 10% from five months earlier." For some perspective, I looked at the top 10 companies in the S&P 500, and none have short-interest above 2.7%.
GM is up almost 69% year-to-date, so those shorts are getting hammered. This despite the fact that their financial situation is still quite dire. So those analysts that did exhaustive research back at thebeginningg of the year and concluded that even if the turnaround is going well, the company will still be on thin ice were right in their research, but wrong on the price.
Such is the danger of taking the well-traveled road. In order for the price of GM stock to go down, people have to sell the shares. But with short interest at a whopping 17%, who is left to sell? The right trade would have been to say "Hey, things are really bad over there at GM, but at this price, with this much bad press, and with short-interest this high, anysmidgenn of good news will send the stock much much higher. And all but the mostdisastrouss news is already priced in. I'm going long."
Now, I know I'm just a dumb bond guy, but the principal applies all over the investment world. Always follow the trade less traded. It will make all the difference.
Thursday, July 27, 2006
Gotta keep on a-rollllllllin'!
The Treasury will be holding another 30-year auction. They do it as a re-opening, which means that rather than create a new security, they will simply add on to the old 4.5% '36 issue which was sold in February. The deal won't get as much hoopla as the February auction, which was the first since 2001, but it may none-the-less be a big deal in the corporate bond market.
That is because I'm hearing dealers want to start trading long corporate bonds off the new 30-year after the auction is complete. Up until now, long corporates were quoted off the "old bond," or the 5.375% 2/31. Currently there is about a 6bp difference between the two securities, with the old bond yielding more. Traders refer to the movement from one benchmark security to another as a "roll."
For the non-corporate bond traders reading this, here is the analogy.
Let's say you drove by the gas station and saw $3.10/gallon at one station. Then the next station says $0.80/quart. The gas is the same. You know its 4 quarts per gallon. As long as you can do elementary school level math, you know that the second station is charging $3.20/gallon.
So in the corporate bond market, you hear one dealer offer Goldman Sachs 6.125% '33 at +140/old bond. The second dealer offers the same bond at +143/new bond. You know the new bond yields 6bp less than the old bond, so the first offering is better. Simple arithmetic, right? Its an efficient market, so the second dealer should never get away with selling his bond tighter just because he changed the benchmark, right?
Well for some reason, the corporate bond market doesn't work that way. Every time they roll to a new benchmark, bonds get tighter. Just more proof the market isn't quite as efficient as it should be. Point is, if your broker calls you and says that he can now sell you long-term bonds at a better spread, ask whether he's rolling to the new bond. If he claims to not know what you're talking about, get a new broker.
Jack and Jill went out the yield curve to fetch a little yield
The yield curve is inverted, right? Which means if you want to increase the yield of a bond portfolio, you should buy shorter bonds, right?
Not so fast. The Lehman 1-3 year Government/Credit index yields 5.29% as of last night, but the Lehman 5-10 year Government/Credit index yields 5.58%. How can this be? The fact is that the only yield curve that is inverted is the Treasury curve. Take a look at the following large issuers with large bond deals maturing in both 2-years and 10-years and an approximate yield available on each issue. Yields are based on quotes or trades I've seen that I think are accurate unless otherwise noted.
Treasury: 2-year - 5.03%, 10-year - 5.02%
Fannie Mae (non-call): 2-year - 5.33%, 10-year - 5.43%
General Electric (AAA/Aaa): 2-year - 5.46%, 10-year - 5.71%
Citigroup (Aa1/AA-): 2-year - 5.48%, 10-year - 5.83%
Target (A+/A2): 2-year - 5.48%, 10-year - 5.76%
Comcast (BBB+/Baa2): 2-year - 5.70%, 10-year - 6.40%
Generic 6% FNMA MBS: 15-year - 5.81%, 30-year - 6.19%
(Source: Bloomberg)
Generic Tax-Ex. Municipal (AAA/Aaa): 2-year - 3.69%, 10-year - 4.10%
(Source: Municipal Market Advisors)
Most money markets are in the 4.50% to 5.00% range, depending on how much in fees they are charging. Point being, you do get more yield by going out the yield curve in virtually all areas of the bond market. Why? Because most bonds have multiple types of risk, and those risks tend to increase as time to maturity increases.
Most obvious is credit risk. Obviously a company is more likely to default sometime in the next 10 years than sometime in the next 2 years. Analysts like to say we have more "visibility" about the near term compared with the long term. For example, we know that Comcast has a near monopolistic position in cable TV services in many of the regions it serves. They are using this position to make major in-roads in the high speed internet business. That is unlikely to change much over the next 2 years. In 10 years? TV technology will undoubtedly change over that time possibly in a way that severely harms Comcast's business.
The municipal yield curve is funny. It just refuses to invert. That's a subject for another post, though.
Wednesday, July 26, 2006
What if they changed the color to fuchsia?
The Beige Book, which is really a collection of anecdotes submitted by the various Fed regions every six-weeks, paints a picture of a slowing but still benign economy. The Treasury market likes it, as the 10-year is up about 1/4 point. We are also getting a fair steepener here, with the 2-30 year slope steepening 4bp on the day. FF futures are rallying.
I wrote recently that I was long-term bullish but I was looking for a better entry point, around 5.50%. I'm backing off that. The data is softening faster than I thought it would, and now I can't see the Fed going past 5.50%, and I suspect they'll take 1-2 hikes back sometime early next year. That means we're looking at FF around 5.00% in 1Q 2007. I can see the 10-year at 4.75% or so at that point. If for some reason they do go past 5.50%, then the odds of a serious recession go way up, and ultimately long rates will fall even further.
I'm still near-term bearish. The 10-year is overbought and ripe for a negative surprise. That's entirely technical, though. Now my entry point is probably 5.15%-5.20% depending on how things develop.
Yesterday, Today, Forever?
GM reported another gigantic loss, $3.2 billion, but this includes over $4 billion in special charges related mostly to recent job cuts. While I'm always suspicious of special charges, this sounds like progress to me. The company does have an impressive stash o' cash ($35 billion as of 3/06), so they can afford to spend cash now to realize long-term savings.
But the situation remains dire. My favorite cash flow measure (operating cash flow less cash cap ex) has been negative in 5 of the last 6 quarters. GM has $33 billion in bonds and loans coming due between now and the end of 2007. For now, GM can borrow from the capital markets, albeit at a hefty price. As long as that remains the case, the debt maturities can be funded by selling new debt.
However, if their operating situation doesn't improve and their cash balance declines, they may be unable to issue debt. Alternatively, the cost of issuing debt may become so high as to further deteriorate GM's cash flow.
My money is on bankruptcy in 2007.
Tuesday, July 25, 2006
TIPS auction goes well
The TIPS market is flying after the Treasury's 20-year TIPS auction went quite well. The 2032 TIP is up about 1/2 point, while the 30-year is down 1/4.
Previously in this space, I have written about the implied inflation curve based on Treasury yields versus TIPS. Here is the updated graph. This curve continues to flatten. The slope from 2 to 10-years started the year at +19, was only +5 on 6/30, and is now -1. Similar pattern as 2-30, which went from +48 to +28 to +24. I think this is a pretty good indicator of how tight monetary policy is. Now that this curve is inverted between 2-10, it tells me that investors no longer expect accelerating inflation. The Fed isn't behind the curve. A pause is imminent.
The Fed, long-term interest rates, and other unrelated data
In February 2005, Alan Greenspan famously described the decline of long-term interest rates in the face of rising fed funds as a "conundrum." While the 30-year Treasury yield is now nearly 100bp higher than its lows, its yield is basically unchanged since April 2004, when fed funds was 1%. To look at the chart on the two rates, you would certainly suspect these two time series are completely unrelated.
(I have a chart, but Blogger's image upload tool is down.)
We can debate the reasons why the two rates have disconnected. Pension problems are currently in the news, as Congress is nearing pension reform legislation. We all know that pension funds are major buyers on the long-end. I am a big believer in the Fed credibility theory, which is that while near-term inflation may ebb and flow, the Fed has a good handle on long-term inflation, and therefore there is no reason for long rates to respond to short-term inflation fluctuations. Since investors view long-run inflation as a low risk, they require less of a risk premium to own long bonds.
Regardless of the reason why long-term rates have been sticky through this Fed cycle, the real question is will they be sticky through the next cycle? Right now, we are hearing some bond managers sound more bullish on rates, including the famous Bill Gross. But how to express a bullish stance? If long-rates are sticky, you may buy long bonds and see little or no price appreciation. Meanwhile it may be 5-7 year bonds that see all the price appreciation.
"Things are different now" are probably the four most dangerous words in investing. Its the mantra that hoodwinked people into buying tech stocks in 1999. But the truth is things are always different now. There are just too many variables impacting the economy for any one situation to be the same as another situation. For example, Justin Lahart of the Wall Street Journal recently compared now to 1994-1995. Then we had a well-established FOMC chair, falling oil prices, and a more stable geo-political situation.
We in the investment business owe it to our clients to rationally analyze whether a fundamental change has occurred in the relationship between short and long-term interest rates. I think there are a lot of bond buyers who are figuring the 2004-2005 experience was a one-time event, and the relationship between short and long-term rates will return to a more normal pattern. Whether that's right or wrong, I think that's inadequate analysis.
Monday, July 24, 2006
HCA update...
HCA's biggest issue is the 6.5% 2/16, which came at +200 on February 8. I heard the market was something like +300/290 on Friday. Today most of the trading is in the +450 range. That's something like a 9-point loss in 1 day, and close to 20 points since issue.
If you had asked me in 2004 how the corporate bond market would handle the current rash of LBO's, I would have guessed the whole market would widen 40-50bp or so. In the past, corporate bond buyers have been much quicker to punish all bonds for problems in certain areas. Take the accounting scandals of 2002 as an example. There you had a few companies who were outright fraudulent with their books (Enron, Worldcom), and many more who were pushing their accounting too hard (Freddie Mac). The OAS on the Merrill Lynch Corporate Master index (all investment grade) moved more than 90bp wider from mid-2001 to late 2002.
The recent widening has been very tame. The recent tightest point in OAS on the corporate index was 81 in February 2005. It is currently 97. I guess you could argue that many companies are just not practical LBO candidates, whereas any company could have accounting problems. However, I'd counter argue that any company can choose to increase its leverage, even if an actual LBO is not an option. In fact, because so balance sheets are so strong among corporations generally, more companies could choose to increase leverage as a means to improve shareholder value today than anytime in recent past. See the post on Cisco Systems.
HCA to explore private parts...
If you are a stock holder, its unequivocally a great outcome.
If you are a bond holder, its your worst nightmare.
If you are a disinterested capitalist, you know this is the efficient market at its best.
Its called an LBO. And they are growing more popular every day.
The latest company to get caught up in the LBO craze is HCA, the largest hospital operator in the U.S. You can read all about the details here (subscription required). I note that the premium is only 7% higher than Friday's close, so the Frist family must think the company will truly be worth more private or this wouldn't be much of a deal for them.
I haven't seen any quotes on HCA bonds today, but generally when a Ba-rated company increases their debt load 2 1/2 times (as is rumored to be the case here), the bond rating suffers greatly. Basically the group providing the equity for an LBO is saying, "This company is too conservative with its balance sheet. Return on equity is the name of the game, and it could be much higher if the majority of the firm's assets were funded by debt. Bond holders may whine about it, but management doesn't work for bond holders. We'll just tell them to shove it."
The situation is grim for bond holders. Private equity firms raised $134 billion last year, and considering that LBO's involve large amounts of leverage and usually significant contributed capital from other principals, private equity firm's buying power is substantially greater. For example, according to the Wall Street Journal, Merrill Lynch, Bank of America, Citigroup and J.P. Morgan are helping to arrange $15 billion in new debt to fund the transaction, which is valued around $21 billion. So the private equity group is putting up about $6 billion and leveraging their money 3 1/2 times.
Meanwhile, according to Private Equity Intelligence (quoted in a Bloomberg News story), private equity firms may raise $300 billion this year. At 3-4 times leverage, that gives private equity firms more than $1 trillion in buying power.
The bottom line is this. If you own a diversified portfolio of stocks, odds are good one or more of them will become an LBO target, and you will enjoy wonderful profits. If you own a diversified portfolio of corporate bonds, one or more of them will become an LBO target, and you will suffer.
Friday, July 21, 2006
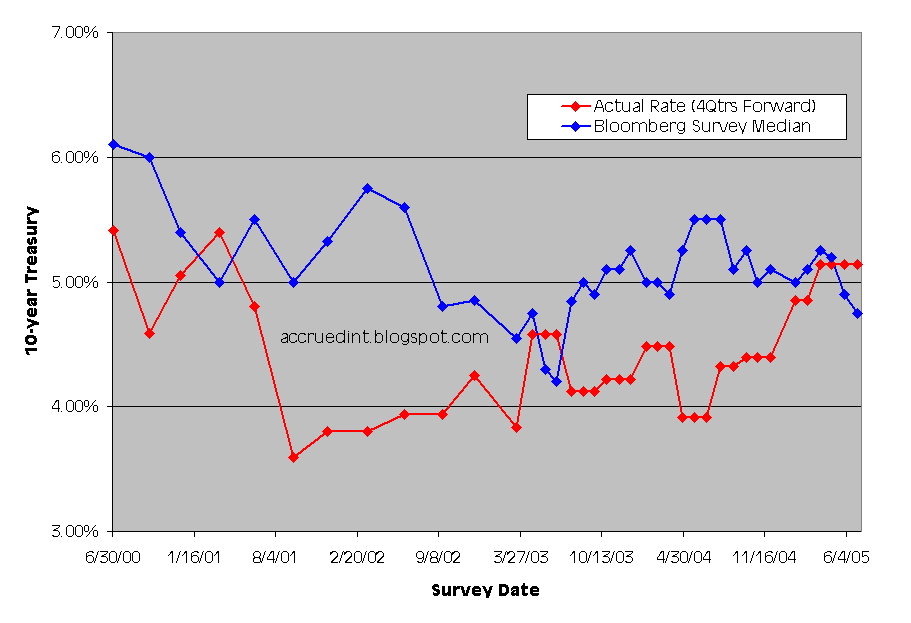
Even a broken clock is right twice a day...
There is an old saying among economists. When making a prediction, give either a number or a date, but never both.
The 60 or so economists who respond to Bloomberg's monthly survey can't resist the temptation however. Participants are asked to predict various figures in the investment markets, such as the level on the 10-year Treasury, at each of the next six quarter-ends.
I have been tracking their success since June 2000, looking at the median predicted level on the 10-year Treasury approximately 4 quarters forward versus the actual level. In short, their record has been abysmal. First of all, the median survey level has predicted higher 10-year rates one year forward in every survey since 2000. Rates actually rose 57% of these periods. The median prediction deviated from the actual by an average of 78bp. That's 1 1/2 standard deviations from the actual rate! Here is the chart of the predicted versus the actual.
 Perhaps the most damning thing about this survey is that the correlation between the median prediction and the actual 10-year rate 4 quarters hence is only 0.03. However the correlation between the predicted 10-year rate and the prevailing rate at the time of the survey is 0.88!
At first the survey's ugly record may seem surprising. But if you think about the concept of market efficiency, you realize a survey can't possibly be anything but noise. If the economists surveyed are representative of actual market participants, then their outlook is already priced into the market. In other words, if you think rates are going to rise, you have already positioned your portfolio for rates to rise. In other words, you either don't own any bonds, you have shorted bonds, or you are underweight bonds. If literally everyone had the same prediction, everyone would have already sold their bonds. There wouldn't be anyone left to sell to drive prices lower.
In the real world, we'd never have it where everyone had the same prediction, so the previous sentence can't be literally true. What is true, and I think what we witnessed with the 30-year in 2004 and 2005, is that when there is a ton of cash on the sidelines because sentiment is overwhelmingly bearish, the market is likely to move the other way. The market becomes thin and any buying moves prices higher (rates lower) rapidly. Then those holding cash get nervous, because they are facing lower and lower investment rates. Some capitulate and start buying, which pushes rates even lower, causing others to capitulate, and so on...
For the curious, the median prediction for the end of 2Q 2007 is 5.25%, according to the survey conducted between 6/30 and 7/10. Leave a comment if you have any questions about my methodology.
Thursday, July 20, 2006
Psychic Investment Advisor...
Yes it is I, the psychic investment advisor here to amaze you with my incredible mental powers... Now, I will predict whether your portfolio made money or lost money yesterday.
First, I will need complete silence. I may be psychic, but I'm easily distracted.
Now I will ask you a few questions. Do you own Yahoo? No? Good, because that stock got hit like a Lebanese airport.
OK. Are you long anything? I mean, other than Yahoo? Stocks, bonds, gold, orange juice futures? ANYTHING? Yes? OK good. You had a great day yesterday.
Back to being serious for a moment. Seems like Ben Bernanke can't win. When he was sounding hawkish, market commentators were blaming him for causing volatility in the markets. Now I'm hearing a lot of people complain that he is being unclear about his intentions. Here is the problem with this line of thinking. The FOMC simply doesn't know what it should do next. My take on yesterday's commentary is that Bernanke and co. think they have pushed rates high enough, or almost high enough, to achieve price stability. With consumers spending looking weaker, its hard too see inflation accelerating from here. But here is the thing about economies. THEY'RE DYNAMIC!!!! There are literally thousands of variables interacting with each other impacting the U.S. economy. The Fed may be staffed with the world's best economists, but they still can't possibly predict exactly how any given monetary policy regime will ultimately effect the economy.
John Maynard Keynes once accused of inconsistency responded with "When the facts change, I change my mind. What do you do, sir?" We should afford Ben Bernanke the same grace.
Wednesday, July 19, 2006
Nevermind...
In a highly disapointing development, Ben Bernanke apparantly doesn't care very much about how I'm positioned. Greenspan had the same problem.
Apparantly Syria and Iran have decided to stand behind Hezbollah, according to UPI. If the Israeli military enters Syria, all bets are off. Don't let anyone tell you that the war is why the Treasury market is rising, though. Stocks are up 160 and oil is flat.
Next stop: 5.20%
CPI came in line with expectations, but the core figure was 1/10 higher, so the 10-year is down 1/4 point. I need about 1/4 point more to get to 5.20%, and I'd guess that the reaction to CPI is a bit muted because people want to hear Bernanke's testimony before trading it too aggressively. Fed Funds futures look like 5.5% is almost a lock for September, and is more than a lock for October, meaning that there is a slight chance of 5.75%.
Corporates and MBS are doing pretty well today. J.P. Morgan's strong earnings are helping the stock/corporate bond market.
What's an Investment Bank gotta do??
J.P. Morgan posted earnings this morning. EPS from continuing ops was $0.98 vs. analysts estimates of $0.87, and 253.6% higher than 4 quarters ago. Not bad for a business that's supposed to be struggling amidst a choppy market. In all, we've had 5 of the largest brokerage firms report earnings in June and July. Here is the percentage change in diluted EPS over the same quarter last year.
6/12 -- Lehman Brothers, +49.6%
6/13 -- Goldman Sachs, +179.5%
6/15 -- Bear Stearns, +78.0%
6/21 -- Morgan Stanley, +116.3%
7/19 -- J.P. Morgan, +253.6%
The S&P 500 Investment Bank & Brokerage index is up almost 22% in the 12-months ending 7/18/06 (S&P 500 up 3.21%), but is down 13.93% since hitting a peak on 4/20 (S&P down 5.25%). Here we have 5 companies with extremely impressive growth rates, strong balance sheets, ample liquidity, diversified revenue streams, long histories of surviving tough times, and declining P/E ratios. It looks like the inverted yield curve and (possibly) burgeoning bear market for stocks is causing selling of these companies. But keep in mind, the 2-10 year slope has been 30bp or less since last July, and has been 20bp or less since September. Somehow Wall Street keeps finding a way to make money. I wouldn't bet against them.
Tuesday, July 18, 2006
One Down...
I called for the 10-year to hit 5.20% some time this week on the theory that sentiment was overly sanguine. Reinforcing my point, we get a in-line PPI report this morning, and it causes a 1/4 point sell-off. I think if it becomes clear that the Fed is going to 5.5%, the 10-year can't hang around 5.0%. At least not until a cut is in the offing.
Foreign security purchases came in strong. Treasury market doesn't care. The Asian bid for high-grade corporates and MBS have been a support for spreads, so that may help those markets.
MBS market is outperforming the 10-year by 3-4 ticks. Corporates are firm, media in 1bp or so. 10-year TIPS outperforming by 1 tick.
Monday, July 17, 2006
ZIRP Redux
Stock and bond markets are very quiet today. Seems like no one wants to take a position ahead of inflation data and Bernanke's testimony. I'm still bearish, because I believe the Fed is more hawkish than the market currently suspects.
MBS and corporates were soft today, but volume is too light to draw much conclusion. TIPS underperformed by about 1 tick.
A followup on the ZIRP from the other day. I made the rather bold statement that if another LTCM-type event is coming, the ZIRP will be the culprit. Here is why I say this:
Active monetary policy, as practiced by all the major world central banks, is basically an attempt to interfere in the marketplace in a way that softens the impact of business cycles. Today, modern central banks generally view reducing price volatility as their primary objective. All but the most ardent of Libertarians agree that, in general, central banks have been quite successful in controlling inflation and the world economy has benefited from well-executed active monetary policy.
But make no mistake, when a central bank sets interest rates, they are artificially manipulating the price of money. The effect is no different than when artificial prices are set in the goods market -- there is either a shortage of supply or demand to meet the other. When New York manipulates rent prices lower through controls, the result is more people who want to rent than there are property owners willing to rent. Its no different in the financial markets. When the Bank of Japan is willing to loan at 0%, borrowers from all over the globe are lined up around the block.
From the borrower's perspective, its simple arithmetic. You have an investment that produces cash flow x. If you can borrow such that your interest cost y is less than x, borrow the money and make the investment. The more uncertain you are about x (i.e., it is risky), the greater you need (x - y) to be. So as y falls, the market takes more risk. If y is falling because of central bank manipulation, the likely result is that the market is taking more risk that would otherwise be the case.
Now let's say the central bank stops manipulating rates lower and allows rates to return to a natural equilibrium. Now the risks that were reasonable under yesterday's borrowing rate are no longer reasonable. The market for risky assets diminishes, and the marginal buyer of risk sees the value of his portfolio decline. Lately, this marginal buyer has been hedge funds.
At the same time that the market for risk is souring, let's say that a hedge fund experiences calls on its assets. Could be margin calls, could be investor withdrawals, or could be a duration mismatch on their assets and liabilities. Now they are forced to liquidate risk assets into a market that is already soft. The selling becomes self-feeding: the fund sells, the price of their assets falls because of the selling, the falling price causes more margin calls. Eventually, the fund is forced to close. If the fund is big enough and/or its trades are similar to many other funds, you have another Long Term Capital event.
No one can reasonably put odds on such an event, so I'm not going to try. We know that the U.S. Federal Reserve has moved their target rate from 1% to 5.25% and the financial markets have taken it in stride. What we don't know is how many risk buyers have survived elevated rates in the U.S. by borrowing in yen. I can say that anecdotally, I've heard borrowing in yen has been rampant.
Geopolitics and Investment Markets
This is going to be a busy week, PPI tomorrow, CPI and Bernanke testimony on Wednesday. I think we’ll know whether the Fed is going to move again by the end of Wednesday.
The current crisis in the Middle East has not resulted in any kind of flight-to-quality bid for U.S. Treasuries, surprising some commentators. The stock market has been sharply lower since the flare-up in hostilities. I thought it would be interesting to look at what happened to the markets during the 6-day War in 1967, the last time open warfare was waged between Israel and various Arab nations.

While the stock market was very volatile during this crisis, bond yields moved steadily higher. Looking solely at events surrounding the war, we see that two of the major escalation events leading up to the war resulted in sharp sell-offs in the stock market. On the other hand, the stock market moved steadily higher during the actual war, possibly due to relief that the super powers stayed out of the conflict. I’d love to hear from anyone who was in the business at the time who can shed light on what the market was like during this conflict.
For the curious, here is a similar chart on the Cuban Missile Crisis. I’m shocked that the very real potential for open war between the U.S. and the U.S.S.R. caused so little market reaction.

Friday, July 14, 2006
This just in... Ford is in financial trouble...
In what can hardly be called news, Moody's downgraded Ford Motor Corp and Ford Motor Credit (FMC) today. The parent is now rated B2 (was Ba3) and FMC is now rated Ba3 (down from Ba2). As Han Solo once said to C3-PO, "I'm glad you're here to tell us these things," Moody's.
On April 5, 2005, when Moody's first put FMC (then rated A3) on credit watch negative, their benchmark 7% 2013 issue was trading around +300/+310 to the 10-year. Disney 6.2% of 2014 (then Baa1) was around +60/10-year at the time, Time Warner (then Baa1) 6.875 2012 was around +75/10-year . And Moody's calls themselves an "investors service"?! Sounds like the investors were well aware of Ford's problems before Moody's "informed" us with ratings changes. Correct me if I'm wrong, but doesn't the majority of Moody's revenue come from bond issuers? I seem to remember someone telling me something about not being able to serve two masters.
Meanwhile, the uptick in oil has helped TIPS have a pretty good 2 days. The old 10-year TIP (2% due 1/15/16) has outperformed the current 10-year by 11 ticks the last two days. I'd sell the heck out of TIPS here. 1) Maybe oil will go to $100/bbl and gas will be $4/gal. But if it doesn't and just stays here, the energy component of CPI will be pretty tame next year. 2) If monetary policy is effective, the Fed's activities so far should give us some degree of dysinflation next year. 3) TIPS will always get a special bid from those who have CPI-related liabilities. From time to time, what looks like a nice bid for TIPS may actually be pension funds putting more money to work in an asset that better fits their liability stream.
Mattress Fund Looking Pretty Good
Stocks are getting killed today, again. Hawkish Fed... very soft start to earnings season... weak retail sales report... not much for stock buyers to like. Corporate spreads are also weak today. Media has been getting the brunt of it so far this month among the large investment-grade sectors. Homebuilder DR Horton is getting whacked today, widening by 10-20bp, depending on where you are in the curve. I haven't seen trading in other home builders, but I will say that you have to have some kind of stones to own home builder bonds. Risk in the bond market is binomial -- either you make a relatively small amount of profit, or you suffer a very large loss in the event of a default. A company like Centex, which is rated Baa2/BBB, has 10-year debt trading around +180. You can buy AAA-rated General Electric bonds at +70, so you make about 1.1% to own Centex over GE. If the housing market gets really bad and Centex goes belly up, you lose 50-60%. Put another way, Centex only has to widen about 15bp to cause a 1.1% price decline, eliminating the yield advantage. I just don't like the risk/reward.
Treasury market is about flat. The 10-year is currently +2 ticks on the day, was down 2-3 ticks earlier in the day but as the stock market sell-off accelerated, it looks like a small flight-to-quality bid emerged. It feels like the 10-year has hit a pretty strong resistance point at 5.05%. I still bet we'll see 5.20% within the next 5 trading days.
In other news, this blog was mentioned in the Wall Street Journal's MarketBeat section (subscription required) for my post on the ZIRP. Maybe now more than 2 people will discover the blog.
Money for Nothin'... Spread for Free
Today marks the end of an era for many hedge funds and speculative players in the bond market. The Bank of Japan has ended its Zero Interest Rate Policy (tm), affectionately called the ZIRP by those who profited greatly from it. For the last six years, the BoJ has kept their target interest rate at zero in a desperate attempt to revive their moribund economy. Now with private banks finally willing to lend and citizens finally willing to spend, at least a little, the BoJ must begin the tricky task of normalizing interest rates.
Removing the ZIRP without plunging their economy back into deflation will be like trying to defuse a bomb while wearing mittens and a blindfold. The Japanese economy has been either in bubble or bust mode for the last 30 years, and no one deserves more blame than their central bank. In the 80's, when it looked like the Japanese way of doing business would one day take over the world, the BoJ was too cozy with private bankers to take on the problem of a real estate bubble. By the time they acted, the bubble had gone too far for the air to be let out slowly. The bust caused both a bank crisis and generalized deflation.
Yet again, the BoJ was slow to act. By 1992, CPI had already fallen from 4% to 2% in less than 18 months. They did cut rates slowly between 1991 and 1995, but CPI kept plummeting, falling below zero in 1995. Many American economists, including Ben Bernanke, wondered aloud why Japan didn't simply print money to cause inflation. Their central bank had lost all credibility to control prices, and therefore even an overnight rate of zero took many years to have an impact. Even now, 4 out of the last 12 monthly Japanese CPI prints have been negative, so to say that they are safely out of the deflation woods is extremely premature.
If the populace smells deflation again, they will go back to their old over savings ways. Deflation creates an incentive to just hold on to money because falling prices makes cash more valuable. Over savings fuels deflation, because businesses feel compelled to cut prices to move product. If the BoJ hikes too fast deflation will return. If they continue with the ZIRP, there is a serious risk that a new asset bubble will form, destabilizing the economy again.
Meanwhile, traders around the world have benefited greatly by borrowing cheaply in the Japanese markets and investing in risky assets to capture the spread. I believe this has been a major driver in the sell off in emerging markets stocks and bonds over the last 2 months. To a lesser extent, this may be fueling the move in corporate spreads over the same period. The market now sees Japanese short-term rates moving into the 1-2% range over the next 12-18 months, and this move will squeeze many risk traders. Many have talked about the exponential growth of hedge fund assets over the last 3-5 years, and some have feared another Long-Term Capital Management-type catastrophe. If such an event occurs, you'll be able to trace it back to the ZIRP.
Thursday, July 13, 2006
Interest-Only Mortgages -- Where's the Risk?
How bad is the housing market? How much might slowing home prices impact economic growth? It feels like most pundits writing in the popular press fall into two categories: either they are dismissive of any kind of housing slowdown, or they are alarmists using terms like “bubble” and “crash.”
Let’s look at some actual numbers. At the end of 2005, 17% of all mortgages outstanding were non-amortizing ARM’s, where the borrower pays interest on the debt but not principal for the first several years of the loan. About 1/3 of these loans (6% in total) were so-called “option ARMs,” which allow borrowers to make payments which are less than the full interest due. If the borrower does not pay the full amount due, the extra interest is tacked on to the principal of the loan. After the non-amortizing period ends, the borrower’s monthly payment increases substantially, because at that point the borrower must pay both principal and interest. The interest rate on these loans also resets, usually at the same time the principal must start being repaid. Since interest rates in general are the highest they have been in 5 years, virtually all ARM borrowers would be facing higher rate resets if their loan reset today. For example, a borrower who has a 4.84% interest-only ARM fixed for 5 years (the average outstanding rate, according to Bear Stearns) would start out paying $605 per month on a $150,000 loan. If that loan reset today and principal starting being due, the payment would increase to $1,060 per month.
Rather than just accept the steep increase in payment, the borrower could refinance the current interest-only loan into a new interest-only loan, therefore delaying the time until the principal becomes due. However, because interest rates are so much higher, the borrower still faces a substantially larger payment. Today the available rate for a 5-year interest only loan is 6.39%, according to Freddie Mac. That means the borrower’s payment would rise from $605 per month to $799.
A lot that has been written about interest-only loans has focused on the increased payment when principal becomes due. But this ignores borrower’s options, and therefore misestimates their likely behavior.
There are about $1 trillion in interest-only mortgages outstanding. Using the 4.84% average rate figure, we estimate annual payments from these borrowers of $50 billion. If they all got new loans today, they would be facing payments $66 billion per year. Certainly a sharp percentage increase, but a decrease of $16 billion in consumer spending is only about 0.1% of GDP. We also know that not all borrowers will refinance at once. Most will probably wait until very close to reset to refinance. The average time to reset for all outstanding ARMs is 34 months. So the impact of increased mortgage payments on GDP will be very small in any given year.
The problem won’t come from the average borrower, but from the borrower who stretched to purchase their current home by using an interest-only ARM. How many borrowers are in this situation is not easy to estimate. Some borrowers may have started out stretching but their economic situation has improved since. Now being totally speculative, let’s say that 10% of interest-only borrowers are really stretched and wind up defaulting when their loan resets. U.S. GDP is $13 trillion, so $100 billion is about 0.8% of GDP. If we assume the reset dates for at-risk borrowers is distributed the same as all ARM resets, and we assume the defaults simply subtract directly from GDP, we’re looking at a reduction in GDP growth of about 0.2% each year for the next three years.
We know that mortgage ARM resets are only part of the economic impact that a slowing housing market will have. After running the numbers, I’m hard pressed to say that ARM resets themselves are a big problem.
Tuesday, July 11, 2006
Afternoon Coffee Break...
Treasury market rallied this morning but is fading a bit now. I think 5.03% on 10's is a significant resistance point. The market tried to break 5.08% today, but failed and is now at 5.10%. I'm still bearish on Treasuries. I'll bet the 10-year prints at 5.20% some time within the next 10 trading days.
10-year Treasury is outperforming the 10-year TIP by 3 ticks at of the moment. The differential is 2 ticks for the 30-year. As was written in the piece about the Inflation Curve, if TIPS underperform Treasuries, the market is saying a Fed pause is near.
Corporates seem well bid. MBS performing in line.
And Now for Something Completely the Same
Serena Ng loved my post about Cisco Systems so much that she used the same idea for her article Corporate Debt Begins to Worry Bond Investors in today's Wall Street Journal (Page C1) or here (subscription required). Thanks for the plug Serena, except you forgot to mention this blog. Oh well. Maybe, just maybe she came up with the same idea on her own, given that Cisco did do the largest corporate deal of the year. Plus she hardly used any of the same facts or figures I did. Oh, and the article is only in part about Cisco. Alright, maybe I won't call a copyright lawyer. In all seriousness, it is a good article and the trend she is discussing may be the dominant force in the direction of corporate spreads over the next 1-2 years.
I am going to e-mail the editor of the Market Beat section of the WSJ Online and see if they'll mention this blog in their daily blog roll as a complement to Ms. Ng's story. You can e-mail them here.
I won't bore you with what the market is doing, because its boring. Close your eyes and visualize yesterday's Treasury yields... let go of your Bloombergs, for you no longer need them...
Monday, July 10, 2006
Monday Close: Why Bother?
I'm hearing volume so light in Treasury trading that you'd think tomorrow was Labor Day. Treasuries rallied late in the morning to 5.12% on 10's and hung there all day. MBS outperformed by 1 tick, but hard to say that means anything. The minor sell off in oil probably helped the bond market marginally. TIPS underperformed by 1-2 ticks. Since TIPS pay out on headline CPI, any buyer of TIPS is making a bet on oil and/or against the Fed.
Retail sales (Friday) is the only major economic release this week, so we are probably looking at light trading all week.
Monday Open: Weaker
On Friday I said I was bearish on the Treasury market. Fed Funds will be 5.5% either by August or September, and I'm not ready to bet on 40bp of inversion between FF and 10yr. Too many bond market buyers are interested in carry first, everything else second. Until people start talking seriously about Bernanke cutting rates, a deep inversion is unlikely. Anyway, we're opening lower. I'd sell every part of the curve up to 5.25%. Size of the 10yr TIPS auction is announced today, sells on Thursday.
Corporates are mostly unchanged, except median and telecom are a bit wider. I see such benchmark issues as CBS '12's 6bp wider at 103, TWX '12's 4bp wider at 107, T '14's (old SBC issue) 3bp wider at 112, all on the offer side. I like corporates to slowly tighten this week.
MBS is opening slightly better vs. the 10yr. I see FNMA and FHLMC 5.5% outperforming the 10-year by 4 ticks. I like MBS long-term for the carry, but I'd bet on wider MBS spreads in the near term.
Saturday, July 08, 2006
Cisco Systems: Dangerous at any Credit Rating
One fundamental problem we corporate bond holders face is that company management doesn't work for us, they work for stock holders. Sure, they don't want to default on their loan, but sometimes what's best for shareholders is not what's best for creditors. Take the example of Cisco Systems.
Cisco's share price was $19.22 on July 2, 2001. Friday, the stock closed at $19.39. Needless to say that makes for a lot of disgruntled stock holders. Earnings growth has been pretty good, up from $1.9 billion in fiscal 2002 to $5.7 billion in fiscal 2005, but investors are less and less willing to pay growth-stock multiples for a company with 5% revenue growth over the last five years.
So what to do? Their recent $6.5 billion in new bond issues gives us a clue as to their plan. During the tech bubble, when Cisco needed funds for acquisitions, there was no cheaper currency than their own stock. Hence, until this most recent quarter, the company had no long-term debt. Today their cost of capital equation has changed. So when their announced the $6.9 billion acquisition of Scientific Atlanta (only $5.1 when you take out the cash on Scientific Atlanta's balance sheet), Cisco issued debt and paid cash. Note Cisco issued $6.5 billion in bonds to fund a $5 billion acquisition, despite the fact that they had $4 billion in cash on their balance sheet.
Bond holders should really think through the long-term implications of this story. Cisco Systems is currently rated A1/A+ (Moody's/S&P), but would their business be particularly harmed by a Baa or Ba rating? No. Cisco's balance sheet is too good. With Cisco's stock so cheap, management is clearly not be minimizing their cost of capital with the present equity/debt mix. Furthermore, if the company's growth rate is moderating, then Cisco will need to increase financial leverage to achieve an acceptable return on equity.
CSCO 5.5% 2016 issue (A1/A+) has recently been offered in the +88/10yr range. Compare that with Goldman Sachs -- GS 5.35 2016 (Aa3/A+) is offered at +97/10yr. Critics say that Goldman is just one big hedge fund and therefore fraught with risk. However, Goldman needs cheap access to credit in order to function as a business. While Cisco's management is intentionally increasing leverage and decreasing their credit quality, Goldman's management can't afford to do so. In other words, one company is incented against bond holders, and one company is incented with bond holders. And yet, for some reason, bond buyers accept less spread to own Cisco than Goldman.
Fair disclosure: my clients own bonds in one of these two companies. You can guess which.
Friday, July 07, 2006
Rally Continues...
Rally has continued into the afternoon, with the 10-year dipping down to 5.13%, up 3/8. We haven't closed that low since June 14. We aren't getting any good inflation-related data until PPI on the 18th, so you'd think it'd trade sideways until then. I'd bet on yields leaking higher.
Corporate spreads are inching tighter. As I've said, there is just too much cash on the sidelines to sustain an extended spread widening. I've talked to several street dealers who claim that there are truckloads of cash sitting at banks and insurance companies waiting for spreads to widen. But if everybody is already short, who is left to sell credit and make spreads wider?
MBS are another story, because volatility is scaring every body, and I don't think there are as many investors short MBS as are short credit. I think MBS spreads widen over the next 2-3 months while we sort out when the Fed is going to pause. At that point, there are two scenarios: either the market sees a cut in the offing, and the curve inverts more severely, or else the Fed stays steady for a while and the curve steepens. The former is bearish for MBS spreads and the latter bullish. Still, you'll probably outperform Treasuries on carry anyway, so I'm long MBS.
Is inflation going to accelerate from here? The market for inflation-protected Treasuries (TIPS) is telling us no. TIPS pay a normal coupon, but the principal amount of the security also increases based on CPI. So making a slight simplification, the annualized total return on a TIP held to maturity will be Yield + CPI, whereas the same return on a traditional Treasury bond is just its Yield. Subtract the stated yield of a TIP from a similar maturity Treasury, and you get market’s expectation of CPI.
We can string together different implied inflation figures for different time periods to create an inflation curve. Just like the yield curve should be a predictor of future interest rates, the inflation curve should be a predictor of future inflation. For example, the yield differential between a 3-year Treasury and a 3-year TIP should be approximately equal to the average CPI level over the next 3-years. The graph below shows the current inflation curve compared with the curve on 12/31/05.
Back in December, the curve was positively sloped, implying that market participants saw long-term inflation as being higher, on average, than near-term inflation. Today we see the entire curve is much higher than it was at the beginning of the year, but we also see that it is inverted between 2 and 10 years. Note that CPI prints have been between 3.5 and 4% for most of the last 12-months, so the implied 2.74% for the next two years is a significant deceleration in itself. But the curve being inverted tells us that market participants expect even more deceleration of inflation in the long-run. Doing some quick math and ignoring minor details like the time value of money, if the average CPI is going to be 2.75% over the next 3 years, but only 2.60% over the next 10-years, then the average from years 3 through 10 has to be about 2.5%. The Fed would probably be happy with a figure like 2.5% for overall CPI. I think the implied inflation curve is going to be a great indicator of when the Fed will do. If this curve continues to invert, the Fed will become more comfortable with inflation expectations, and a pause is more likely.
Friday Open -- Mixed Bag
Everyone is initially going to focus on the meager jobs number -- 121,000 versus the ADP survey which had said 360,000. Bonds and FF futures are rallying. Don't forget about the hourly earnings figure, though, because that number speaks more directly to inflation pressures than jobs added. Just seeing that the economy has added 121,000 jobs is one thing, but in order for prices to rise, people have to be able to pay more. Wal-Mart can't raise the price of deodorant if no one is willing (or able) to pay the higher price. So one can argue that hourly wages is a more important figure. This number accelerated in June to +0.5% from 0.1% in May.
So on the jobs number, we got my bullish scenario (congrats Jay), but I think the rally will be a bit more muted than I thought because of the hourly earnings number. Curve is flatter by 1bp, swap spreads are tighter by 1/2bp, MBS trailing Treasuries, so out of the gate, I feel pretty good about yesterday's bold prediction. No, I'm not above patting myself on the back.
Thursday, July 06, 2006
Thursday Close -- BOLD PREDICTION
10-year has been stuck at 5.18% pretty much since the ISM number at 10AM. Given the rally today, the tone is muddled, so I’m less bullish going into tomorrow. BOLD PREDICTION TIME!
Bullish: Number comes in under 150,000, hourly earnings in line or lower (0.3% MoM). Bonds rally 3/8 to 1/2, curve flattens 2-3bp. Swap spreads tighten, MBS widen on volatility concern.
Neutral: 150,000-240,000. Might be a slight relief rally, particularly if hourly earnings are tame and/or the number is more toward the bottom of that range. Curve might steepen at the higher end of that range. Swap spreads tighten, MBS perform well.
Bearish: 240,000+ and/or 200,000+ with hourly earnings high. Bonds sell off mildly, 1/8 to ¼. Curve steepens 1-2bp. Spreads widen, MBS underperform Treasuries.
If it turns out ADP was right as we really get 360,000 jobs added, all bets are off.
Did They Also Miscalculate my Paycheck?
The Treasury market has caught a bit of a bid after the ISM Non-Manufacturing report came out a bit weaker than last month. There is also a rumor than there was a calculation error in the ADP report from yesterday. Given the tepid nature of the rally here, I doubt many traders believe the rumor.
Corporates look steady, with media a little wider, but everything else a mixed bag. I favor A-rated bonds over lower-rated issues, as my models show BBB’s and high-yield are still stupid rich. If you’re bearish on the economy, this is an easy call. Even if you aren’t, keep in mind that default rates ebb and flow more related to credit conditions and less with GDP growth. We go through a period when credit is easy and some loans are made (or bonds sold) that shouldn’t have. It takes 2-4 years for the actual defaults to happen. The easy credit of 2003-2005 is coming into that 2-4 year window now.
Market Dead... Er, I mean Flat
Treasury market opening flat. Everyone seems to be waiting for tomorrow's number. I'm bullish on tomorrow only because the tone is so one-sided here that a downside miss on NFP should move the market more than an upside miss. To use a poker term, I think you are getting good pot odds to be long here, even if the odds of a miss in either direction are 50/50.
Thursday Open -- The Only Thing We Have Inflated is Inflation Itself!
While yesterday's trading (and probably today and tomorrow as well) was all about job creation, the markets really only care because the Fed cares. And the Fed really only cares because job creation causes inflation, right?
Not really. Most economists dismissed the idea of a Phillips Curve back in the 1980's, after witnessing the stagflation of the 1970's. If more jobs equals more inflation, how could you ever have stagflation?
Conversely, look back at recent speeches by Fed officials and look at how often they use the phrase "elevated inflation expectations" or some such. Look at yesterday's Wall Street Journal online poll, which had 73% of voters either somewhat or very worried about inflation. Look at gas prices, which is probably the only goods price that consumers can actually observe changing from day to day, and is therefore the dominant factor in how the average Joe views inflation. Inflation expectations are certainly elevated.
As I wrote yesterday, Fed economists seem to favor the rational expectations theory of inflation. This means that if expectations are elevated today, actual inflation is likely to be elevated tomorrow. The only way the Fed can fight rising expectations is by credibly pledging to prevent any significant acceleration of inflation through monetary policy. They will keep hiking until the market and the broader economy gets it. If that means a recession in 2007 or 2008, so be it. Once a central bank's credibility is gone, it takes a long time to come back. Ask Japan, they'll tell you.
Getting back to job creation, as long as job growth is strong, the Fed knows it has plenty of room to keep hiking and not cause any actual pain. In other words, under their dual mandate, they can literally ignore the employment half and focus on the inflation half.
Ultimately this is all bond bullish and stock bearish, but an entry point into bonds is going to be tricky to find. I'd like to say 10yr at 5.50%, but I can't say there won't be more pain after that.
Wednesday, July 05, 2006
Wednesday Close
Bonds bounced modestly off their lows, but nothing to get real excited about. 10-year rallied 1/8 off its intra-day low, 30-year up 10 ticks. FF futures show all but a lock for 5.50% at the next meeting. The rally at the end of June was now pretty clearly just quarter-end window dressing. If the Fed is going to 5.50%, can you buy the 10-year south of 5.25%?
Jobless claims tomorrow. The market is going to look to both initial and continuing to see if there is anything to the ADP estimate. If we get strong numbers, market will probably price in a blowout NFP number on Friday. I think something in the mid-200,000 range is already priced in. Throw out the Bloomberg survey or whatever else you look at as a gauge for what qualifies as a miss, particularly if there is another sell-off tomorrow.
Municipals -- The Paranoid Uncle of the Bond Market
The municipal bond market players are a paranoid and merciless bunch. In 1975, New York City skated on the edge of bankruptcy, but never defaulted. Today the city still trades cheap to other large cities with similar bond ratings, despite the fact that S&P just upgraded it to AA-. The Washington Public Power Supply System defaulted on certain power plant projects in 1983, basically because there was inadequate demand for their last 2 plants to be viable. Today, the system is so strong that their bonds are rated AAA by S&P, and yet those bonds still trade cheap. In fact, many of their deals carry bond insurance on top of being naturally rated AAA!!
Moving on to the current situation in New Jersey, its entirely political. Unless you own some sort of casino-backed bond, the odds are extremely low that the current impasse will have any effect on the ultimate credit worthiness of any New Jersey municipal. And yet, it will only be a matter of time before media pundits and politicians start claiming New Jersey is on the brink of bankruptcy. Then retail owners of New Jersey municipals start calling up their brokers insisting that they need to sell their bonds (and probably pay 2-points in bid/ask on 15 bonds). Before selling your bonds, think it through. Right now, Jon Corzine wants to exercise his political muscle to get the budget he wants. Meanwhile, the legislature wants the budget they want. They will fight this out just until it actually becomes politically painful, and whoever is in the most pain at that moment will cave in to the other.
By the time this situation stretched out to a municipal issuer defaulting, it would have gone way past just painful to the politicians involved. Does Corzine want to find out what the political backlash would be if a school district went bankrupt because state matching funds were withheld?
The California near-bankruptcy didn't cause any actual defaults. Katrina didn't cause any actual defaults (among issuers with taxing power anyway). This situation won't cause any defaults either, no matter how long it drags out.
Corporates Holding
Markets no likey the ADP report. Bond down 1 point, Dow down 75. September Fed Funds futures pricing ~60% chance of a hike, but its more than 100% for October.
Despite stock market weakness, it looks like corporates are generally holding onto their gains late last week. Many stronger IG names are now flat or close to it since 6/1. I guess massive liquidity strikes again. A good recent issue to watch is MER 6.05 '16 (sub note), which started the month of June offered around +98/10yr, widened to +107, but is now +97ish. Did anyone actually think Mother Merrill would go bankrupt over a minor stock market correction?
Wednesday Open -- Does NFP still matter?
Treasuries are lower, as an ADP survey showed strong job growth -- 368K!! Some traders are viewing this as a preview for Friday. The ADP study has shown strong correlation with the NFP figure, for what that's worth.
I used to be in the camp that the NFP report didn't matter anymore, that the Fed only cared about inflation figures. I have changed my mind. I think the Fed wants to keep tightening until it hurts, and as long as payrolls are still strong, it obviously isn't hurting yet. I know, I know, there's a lag in monetary policy. But if NFP are chugging along at a strong pace, it means that all the tightening up until at least 6 months ago haven't had much effect on hiring practices. The Fed can then project effect of the last 3-4 hikes, then convince themselves that one more will still result in acceptable economic growth. I think they will hike and hike until they think there is a chance causing a recession.
A lot of market commentators are asking, "These guys are fighting inflation hard, but where is the actual inflation, outside of energy?" Remember, these guys are big believers in expectations theory -- the idea that if you expect inflation of x, the odds are actual inflation will be right about x. Therefore when they hike, they are fighting a perception of an inflationary future, not actual inflation.
Tuesday, July 04, 2006
Welcome
Quick quiz to determine if this blog is for you.
You are at a party. You are chatting with a friend, when your friend sees someone he knows arrive to the party. "Tom," he says, "Come over here I want to introduce you to someone." Your friend introduces you to Tom and you politely ask Tom what he does for a living. "I'm in investment management," he replies. Your friend suddenly gets serious and asks Tom, "Should I sell my Google shares or what?" You detect a hint of exasperation on Tom's face as he replies, "I have no idea. I am a bond trader. I will tell you that the 2-year is a great buy at 5.25%!"
Your reaction:
A) Your flight instinct kicks in at the dreaded possibility of a discussion on interest rates. You find the nearest window and jump out of it.
B) You figure anyone in the investment business who doesn't know all about Google must be grossly incompetent. Disgusted by the poor company your friend keeps, you indignantly storm off to get a beer from the fridge.
C) You think to yourself, "2-year what? Mortgage? CD? Savings Bond? Money Market Account?"
D) You smile and say, "5.25%? My broker just sold me a Ford Motor Credit bond yielding 10%! And hey, its Ford. They aren't going anywhere."
E) You quickly counter, "Are you kidding? The Fed is sounding more hawkish every day. They might get to 6% by year-end! It might be temporarily over sold, but I wouldn't touch the 2-year below 5.80%!"
If you answered A, B, or C and you are interested in investments, may I recommend every other investment-related blog in the western hemisphere because they all cater to those interested in the stock market. If you answered D, get off the internet and get a new broker. Like, now. If you answered E, welcome to Accrued Interest.
At Accrued Interest, we will discuss both what's going on in bonds on any particular day, as well as the longer-term issues facing the U.S. rates markets. As for my background, please check the profile page on the right. Suffice to say I am a buy-side trader, involved mostly in the cash investment grade market. At different times in my career, I've traded municipals, MBS, Governments, corporates, and to a lesser extent, CMBS and ABS.
Subscribe to:
Posts (Atom)


