Let's take a break from talking about the rout for a moment.
A couple days ago, Greg Ip (often called a Fed mouthpiece), wrote a piece on a new inflation model the Fed is using. This one downplays Phillips Curve effects and focuses more on inflation expectations.
I don't really think this is news. The Phillips Curve fell out of favor both at the Fed and in academia a long time ago. Going all the way back to the Volcker Fed, the idea that unemployment could be targeted was all but dead. Hell, Edmund Phelps won a Nobel Prize for work that helped debunk the Phillips Curve. I think once you actually win the Nobel, your ideas are mainstream.
So if the Phillips Curve is all but dead, why is Greg Ip talking like the Fed is still using it in setting policy? I think you need to read between the lines here, as well as bring your own background into the discussion. Inflation expectations have been a very common theme in Fed papers and speeches from the last few years. Labor market tightness (or slack) comes up from time to time, but often in conjunction with productivity. Plus to ignore the labor market would be silly. In order to have consumer inflation, consumers must spend more. In order for them to spend more, they must have more income. In a world where the effective money supply is hard to measure, income paid to consumers is one way to see whether the money supply is increasing or decreasing. By this view, labor market tightness is not causing inflation, but is an indicator of incipient inflation problems.
So if you read between the lines on Ip's article, it might be that the Fed's official inflation models have had less and less influence on actual policy for some time. Maybe internal politics or other goals prevented a full revision of the model for some reason.
So I say Ip's article doesn't suggest anything of substance is changing here. Probably only something of appearance.
Wednesday, February 28, 2007
News? Not really.
Tuesday, February 27, 2007
Fog of War
On a day like yesterday, where a given corporate should be priced is tough to say. The market tends to lock up, and bids can be hard to come by. Everything is offered. Especially today one doesn't have to sell a bond to get flat on the credit. Just buy protection in the CDS market. The story from Wall Street's bond desks was that they couldn't sell protection fast enough, and that all Treasury offers were lifted.
Anyway, here are some heavily traded names and where it looks like they've ended up. This is based entirely on the best information I can find, so take it as a "best guess" only. (The + number after the quote is how much wider on the day.)
VZ '16 91/88, +10
DT '16 114/111, +4
RESCAP '15 197/192+18
CMCSA '17 111/106 +9
TWX '16 105/100 +9
CFC '16 143/138 +18
BSC '17 103/100 +10
GS '17 108/105 +7
HSBC '16 82/79 +6
MER '16 100/97 +8
C '17 80/77 +5
WM '17 111/106 +8
GMAC '31 $109.375/109.875 -1 point
F '31 $79.25/80.125 -1.75 points
CDX7 36.5 +6 (high-grade CDS, 6bps on an index @30... think about that for a minute!!)
HVOL7 86 +15 (high volume CDS, trying to find out if that's the biggest 1d move ever)
BB7 170 +25 (BB rated CDS)
Dow Falls 666 Points on Fire, Brimstone
Feb. 27 (AccruedInterest) -- U.S. stocks tumbled the most in 7 times 70 weeks as a plunge in Chinese shares, a weak durable goods orders report, and sightings of four horsemen sparked a global selloff and raised concern that the end may be near.
The declines, which extended to corporate bonds, real estate, and gold, wiped out the year-to-date gains in the Dow Jones Industrial Average and Standard & Poor's 500 Index. Only two companies in the S&P 500 rose. RadioShack Corp., an electronics retailer, rallied $2.59, or 12 percent, to $25.04 on strong earnings. Rollins Corp., a leading provider of pest control services, rose $1.27 or 6 percent, to 23.36 as traders speculated the company would benefit from the coming locust plague.
"I saw a 7-headed dragon flying around outside my window,'' said John Titus, who oversees $7 billion as chief executive officer of Domitian Capital Management in New York. "I don't care what the existing home sales number is, this can't be good.''
China's government approved a special task force to clamp down on illegal share offerings and investments with borrowed money after indexes climbed to records. The Shanghai and Shenzhen 300 Index dropped 9.2 percent, wiping out $107.8 billion from a stock market that doubled in the past year.
"The Chinese market getting crushed for 10% or whatever had me nervous in the morning,'' said Jacob Censer, a Senior Vice President at Bear Stearns & Co. in New York. "But our firm plans to be the first to offer digital futures contracts on the date of the Rapture. There are always opportunities in any market or apocalyptic scenario."
An indicator that measures the rate of expected stock-market swings rose the most since at least November 1991. The Chicago Board Options Exchange SPX Volatility Index, known as the VIX, surged 66 percent as investors anticipated more risk in owning stocks.
Alcoa, the world's biggest aluminum producer, tumbled $2.07 to $33.29. China is the leading consumer of the metal. Copper miner Freeport-McMoRan Copper & Gold Inc. fell $5.56 to $56.36 as negotiations to plate the Lord's Throne with the companies gold products fell through.
Caterpillar, the biggest maker of earth moving equipment, fell $3.50 to $63.76. Traders speculated that the raining down of fire and brimstone to punish sinners would likely cause a slowdown in commercial construction.
The Commerce Department said orders placed with U.S. factories for durable goods slumped 7.8 percent following a 2.8 percent gain in December. Orders excluding transportation equipment slid 3.1 percent. Secretary Carlos Gutierrez added "In light of today's events, we might be putting our 'Hand Imprint Payment' program on hold."
"Monetary policy has its limits," Federal Reserve Chairman Ben S. Bernanke told Congress during special hearings today. "But we still see inflation subsiding later this year due to the demographic effects of God calling the descendants of Jacob to heaven."
St. Louis Fed President William Poole, speaking before the Little Rock Chamber of Commerce was more blunt. "I was going to talk about the declining savings rate, but fuck it. Let's go drink."
Flight to Quality?
The easy thing to do is call today's Treasury rally a flight to quality. After all, Shanghai was down 9%, U.S. stocks are opening more than 1% lower, subprime mortgage trouble abounds, and corporate and MBS spreads are wider.
But can you really call a 9 tick rally in the 10-year Treasury a flight to quality? As I wrote in a piece about the Thai coup last year, the flight to quality bid just ain't what it used to be. Frankly, the durable goods order figure was enough to justify the Treasury market movement today on its own, forgetting about the other issues.
The troubling thought that is probably holding the Treasury market back today is whether trouble in China will result in fewer dollars flowing to the U.S. I don't think so, because the fundamental imbalances remain in tact. But its a very scary thought.
Friday, February 23, 2007
Syntax vs. Meaning or Why Alltel won't be a LBO
Bond holders usually cringe when a company announces its "reviewing its strategic options," as Alltel did on Tuesday. These days that usually means you're talking to private equity, and that means your bonds are about to get killed.
Alltel's CDS spread was 70/73 on 12/28. Their 2016 issue, which I own, was 190/195. The next day a Wall Street Journal article said that Alltel would make a nice LBO. The CDS got as wide as 120ish and the 2016 issue as wide as 240 shortly after the story.
But wait. The Wall Street Journal piece didn't mention anything specific. At least on the surface the article read like a journalist doing the LBO calculation, as opposed to any actual rumors. By mid January Alltel CDS had tightened into the mid 90's, and the cash 2016 bonds were down to +200. By the end of February, the 2016 issue had tightened to 155/165. Other than EOP, Alltel was the largest tightener of all corporate bonds in the Merrill indices.
So when Alltel used the phrase "reviewing strategic options" on their analyst conference call, I admit I cringed a little. Even though I strongly believed a LBO was unlikely, the market is paranoid these days. But much to my surprise, Alltel tightened substantially after the call. The CDS are now in the low 70's, and the cash bonds continue to tighten substantially. The 2016's are now 135/145.
Based on where other large telecoms trade, I think fair value is around +100, so there is still room here. But market movement is telling me the LBO discount that had been baked into this bond price is drifting away.
Thursday, February 22, 2007
Mark Thoma says it better
Mark Thoma, author of EconomistView, recently wrote a piece on Barney Frank and the Fed's dual mandate. I wrote about the same topic a few weeks ago, but Dr. Thoma says it better, and carries a hell of a lot more economist cred than I ever could.
Dr. Thoma is not some right-wing type bashing Barney Frank just because he has a "D" after his name. I think regular readers of Dr. Thoma's fine blog, like myself, can make the safe inference that the author did not vote for W. As I tried to say before, and as EconomistView has said much better, the world of economics has moved beyond the views that Rep. Frank is expressing. I wish he'd catch up.
Wednesday, February 21, 2007
The BOJ Hikes Again
The Bank of Japan raised its benchmark interest rate by 0.25% to 0.50% in an 8-1 vote. I found it particularly interesting that Governor Toshihiko Fukui actually mentioned the carry trade in discussing the move: "We're aware that extremely distorted movements in the financial markets, including the yen carry trade, could eventually have a negative impact on the economy."
I've been pondering the Japanese situation, and something has been nagging me for a while. First I note that Japanese CPI is still a mere 0.3%, and real GDP is a modest 2.1%. Normally that's the sort of figures that would call for easing money policy, not the other way around. But Japan has been doing that for a loooooooooong time now to no avail.
Let's take it as a given that the relationship between the effective money supply and consumer prices is absolute. We must then assume that the effective money supply is barely growing in Japan. This despite the BoJ literally giving money away through zero interest rates for most of the last 7 years.
If money is being created but goods prices aren't rising, then the money created isn't being spent on goods. But Milton Friedman hasn't been revoked. If there is more money in the system, then something has to be rising. Unfortunately for the Bank of Japan, global financial integration is allowing the money the BoJ is creating to flow overseas. Perhaps Japanese investors see better opportunities abroad. Perhaps consumers in that nation are fearful about their own future and are more inclined to save. Whatever the reason, the money is obviously not flowing into the goods market. Instead, its flowing to non-Japanese investments, causing various investments world-wide to be trading at historically high levels.
So far, I'm saying nothing unique. But consider the consequence for central bankers of this episode. Bouts of deflation may become extremely difficult to combat anywhere in the world if the result of low interest rates is simply a flow of investment capital out of a country with no appreciable impact on consumer prices. Perhaps the U.S. is in a favorable position in regards to this issue, because our population has a high marginal propensity to consume. But this is all making it tough for me to read what the impact of rising Japanese rates will be. Maybe the BoJ starts hiking, and deflation appears a new. Then we're back to the ZIRP, and the asset bubbles continue to boil. Maybe the BoJ hikes rates and the yen carry trade whithers, but at the same time the yen strengthens and the export economy stagnates. Maybe a financial accident (perhaps even caused by removal of the carry trade) causes other central banks to cut rates as well, supporting the yen and allowing everything to turn out rosy, at least for the Japanese.
We'll see how it plays out. It sounds like the BoJ wants to take a page out of the Greenspan/Bernanke playbook and hike rates slowly, telegraphing their moves. Whether they are successful in normalizing rates will play a major role in investment returns over the next 2-3 years.
ABX Follow-up
Last Thursday's post on the ABX index was the most popular post in the history of this blog, measured by hits. I got a couple comments both on and off line, so I'll try to address a few of these here. Bear in mind that I'm not a synthetic ABS trader, so while I think I understand the ABX index pretty well, I'm sure some understand it better.
First question is how many defaults might it take to wipe out these BBB tranches. That depends on a number of factors, including how quickly the defaults happen and what the recovery is. In March of 2006, I read a scenario analysis produced by Citigroup which estimated that cumulative losses of 11% would not be enough to cause any defaults in investment-grade securities. In this case a "loss" is net of any recovery. So if you assume 50% recovery then defaults could be as high as 22%.
Just a few weeks ago Bear Stearns held a conference call on this subject. There they estimated that the "fair value" for the ABX.HE 06-2 BBB- index was around $90. That was based on assumption of defaults around 15% and recovery of 55%. They actually tailored the default assumption to each of the 20 deals underlying the index. Under their scenario, only two of the underlying deals suffered actual losses, one of 18% and the other of 0.5%.
What of the issue of loans with CLTV greater than 100%? In other words, situations where the borrower took extra cash for "improvements" but never actually made the improvements. Obviously such deals will have low recovery. We simply can't know how prevalent this is, particularly in any given deal.
Is the 70% recovery figure I threw out accurate? I tossed that out as a rule of thumb some people use, but obviously that is influenced by the long history of mostly rising home values. Banks enjoyed strong recoveries in the past because the collateral on the loan was an appreciating asset: as time passes the recovery value only improves. I think we can all agree that we are at least facing a situation where home values will rise very slowly if at all for the next couple years. So recovery is likely to be lower than 70%. How much lower? Depends on which loans go bust when.
What if we suffer a severe bear market in housing prices? This will likely cause both more defaults and lower recovery. How bad the housing market will get is an argument for another time. I reiterate here, however, that other areas of the bond market are not trading like a severe housing downturn is likely. From mortgage lenders to home builders, bond spreads are still fairly tight. The ABX index has been the only area where shorting the housing market has worked.
Finally, when I said someone looking to buy protection on the ABX.HE 06-2 BBB- would have to pay up 18 points at the outset of the deal, here is what I mean. The ABX index trades on a dollar price with a fixed spread payment. If a trade occurs at par, no cash changes hands at the outset of the trade, and the buyer of protection pays the fixed spread to the seller of protection. However, if the trade does not occur at par, one party or the other makes an up-front payment. Subsequently, the buyer of protection pays the fixed spread to the seller. So if the index is at a premium to par, the seller pays the buyer up front. If its a discount, the buyer pays the seller up front.
So yesterday the index closed at $79.04. So in addition to paying the 242bp fixed spread periodically, the buyer of protection must also pay the seller of protection $20.96 up front. Think of it like a plain vanilla corporate. If the credit weakens and the bond widens, the price will fall to compensate investors for the additional risk.
As always I welcome comments.
Tuesday, February 20, 2007
Translating an outlook into a trade
Todd recently asked me the following question in a comment:
How far out are you looking when you make such statements ? And how do your longer term views (1-2 years out) effect your short term trading ?
Great question. I have two core tenets of investing that relate to this.
- There are too many variables for any economic forecast to be particularly accurate.
- Make your bets where you have the best visibility.
To explain, let me use my 10-year forecast as an example. In my 2007 Forecast piece, I predicted a 4.90% 10-year rate by year-end, which I still like. However, when the 10-year was in the upper 4.70% range, I've wrote that I was short-term bullish on bonds. How do you take both ideas and turn it into a trade?
Here is how I thought through my portfolio position at the time. In late January, the bond market looked like it was trading on a buyer's strike. By this I mean, the market looked like long-term buyers were staying out of the market, leaving short-term traders as the only force pushing prices around. You can see my brief case for the buyer's strike here.
When my views are at odds, I ask myself, where is the better visibility? In this case, I look at my buyers strike theory, and felt very confident that the risk/reward was in favor of a small rally. On the other hand, while I still like 4.90% as the eventual level on the 10-year, we were already within 10bps of that number on Jan 31. Not much upside there. Plus, 4.90% is an approximate figure. I view 4.81% as within the margin of error.
So I added duration. So far it has worked out alright, as we're down to 4.67% on the 10-year today.
Another way to play this is to find a play which will work in both cases. For example, I think rates are near their peak at 4.81% on Jan 31. But I think any rally will falter around 4.50%. That kind of low-vol environment calls for a play in MBS. Essentially buying MBS is like shorting options, you can make money on the vega. Put another way, the risk of owning MBS is that rates will fall substantially and your principal will be returned in a lower rate environment. Alternatively, if rates rise your principal will return more slowly, preventing reinvestment at higher rates. If nothing happens with rates though, then you are being paid to take a risk that never materializes.
Thursday, February 15, 2007
ABX -- Falling Knife?
"Never try to catch a falling knife" is one of Wall Street's old cliches. It means that when a stock is plummeting, best to stay away. If you try to catch it as it fall, as with the knife, the odds are you'll end up with a bloody hand.
Of course, its always tempting, as the link above discusses. For example, take a look at the ABX-06 BBB- 2 index, which is an index of BBB minus rated home equity deals. Most of these are sub-prime.
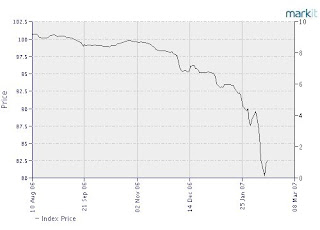 Now for anyone not familiarity with typical price movements the investment-grade bond market, the move by this ABX index is extreme. On a 5-year issue, a 20-point move implies some 400bps of widening. In this interest rate environment, the only coupon paying bonds with dollar prices in the low 80's are companies where serious trouble is imminent. We aren't talking merely about junk-rated issues. We're talking about bonds where near-term default is a distinct possibility.
These ABX indices are a bit complicated and I don't want to get into the nitty gritty of them here. But consider the following: unlike normal CDS, which trade on a spread basis, these trade with a dollar price. So if you see a dollar price of $81.61, that means that in order to buy protection on this pool of home equity deals, not only must you pay the fixed spread over time, (242 bps on this deal) but you must make an up-front payment of 18.39% of the notional value you are buying!
The historical recovery rate on sub-prime home equity is around 70%. So by paying nearly 20% up front for protection, you are putting an extremely high probability on the entire index going default. In other words, not just historically high delinquencies, but truly catastrophic waves of bankruptcies. Around 4% of the loans in this index are currently 60 days delinquent.
No other security in the market is trading like mass defaults are likely. If such wide-spread defaults were going to happen, where would the CDS for names like WaMu, Countrywide or CapOne be trading? According to recent quotes I've seen, the widest of that group is CFC at a whopping 35bps.
Are delinquencies going to be high in 2007? Yes. Are they going to be high in 2008 and 2009 too? Probably. Will more sub-prime lenders go bust? Yes, because they foolishly assumed the good times would last forever. Will there be enough defaults in home-equity pools to justify trading in the ABX index? I doubt it.
Will the technicals that have driven this index to such low levels continue to drive it even lower? In other words, how good are you at catching falling knives?
Wednesday, February 14, 2007
Market bounces after Bernanke
The market is trading as though Bernanke said something surprising. Which he didn't. The upshot is that the Fed thinks inflation is likely to subside from current levels without the need for additional rate hikes. This is because some degree of economic weakness, mostly due to a weak housing market, will put downward pressure on price growth. That being said, the Fed sees higher inflation as a bigger risk than anything else.
This has been the Fed's message, more or less unchanged, since August. Of course, over that time, the 10-year has moved between 4.99% and 4.42%, mostly on varying opinions about when the next Fed cut will be.
So is the next move a hike? Taking Bernanke's statements at face value, it would seem a hike is more likely than a cut. But I'm still not convinced. The Fed knows that housing presents the biggest risk to growth over the near term. The Fed knows that the housing market is extremely rate sensitive. While they are unwilling to cut rates to support the housing market, they may have stopped hiking a little earlier than they might have otherwise.
So that leaves them on hold for a while. But if inflation slows, the Fed will wind up tweaking policy a bit, and I still think that results in a cut or two.
Tuesday, February 13, 2007
Mortgage fall out
In what seems like a delayed reaction, the Thursday's announcement from HSBC is finally moving some investment grade corporate issues wider. The following are some quotes from 2/7 vs. this morning.
HSBC '16 was 67/64 now 76/73 9 bps wider
RESCAP (GM's old mortgage unit) '15 was 167/162 now 170/165 3 bps wider
Centex '16 was 138/134 now 139/135 1 bps wider
Toll Brothers '15 was 157/147 now 155/150 3 bps wider
Washington Mutual '17 was 93/88 now 100/95 7 bps wider
Countrywide '16 was 113/108 now 119/114 6 bps wider
Merrill Lynch '16 was 85/82 now 90/87 5 bps wider
Bear Stearns '17 was 86/83 now 91/88 5 bps wider
Bank of America '16 was 64/61 now 67/64 3 bps wider
In today's low vol environment, a move of 5-8 bps in a couple days is a pretty big move. WaMu has been a weak performer over the last couple years, as concern over a housing slowdown have dogged the bonds. Countrywide would be in that boat as well if not for the recent rumor that Bank of America wants to buy them.
Investment banks are mostly 1-2 wider. There are various concerns related to sub-prime lending and investment banks. First, they might have direct exposure through inventory positions. Second, many people are talking that there are sub-prime MBS CDO's which are still in the warehouse stage, and which their positions are deep underwater. In many cases, investment banks have advanced the money to accumulate the portfolio and will suffer losses if these deals break up. There may also be hedge funds that were heavily involved in this sector which wind up failing. I view these risks as minor for credit investors. They may be more serious for stock investors. I think back to Long Term Capital Management. If the brokerage industry figured a way out of that, they'll figure a way out of this.
Interesting that the home builders are hanging in. Is the market saying that the sub-prime problem won't have a material impact on home builders? No, because their stocks have been weaker the last couple days. I think the market is saying that investment-grade home builders are financially strong enough to weather a period of weakness in the housing market. The sub-prime problem may elongate and/or deepen the weak period, but the fundamentals for the credit are in tact. I agree with that hypothesis.
Of the names listed above, I have positions in Bear and Merrill.
Friday, February 09, 2007
Friday Rout...
Everything is getting killed today after both Poole and Fisher didn't seem too keen on cutting rates. Less reported here in the states is Trichet's hawkish tone today. European bonds were performing about as bad as the U.S. Let's look at what the bond market is telling us.
- The curve is about 2bps steeper
- Swaps are 1.5bps wider
- High-grade corps are 1-2 wider
- MBS spreads wider
You'd be tempted to say that corporate spread widening is a credit issue, particularly with all the negative news surrounding banks and stocks off so severely. But given than corps are in line with swaps, it isn't really a credit thing. I think the market is pricing in more volatility. That is the one thing that fits all four of the above points.
And we could all agree that the outlook for Fed activity is less certain now than 2-3 months ago. Back in November the market was more confident that there was 1-3 cuts coming in 2007 and the debate was more about how many and how soon the cuts would come. A hike sometime in the near term is now in play. Don't believe me? Take a look at the Funds Futures data from the Cleveland Fed. Even before today, the odds of a hike at the June meeting were greater than a cut.
And yet we are hearing more dire news about the state of sub-prime lending. What will the impact of large scale mortgage defaults be? Will it exacerbate already weak housing prices as foreclosure related sales add to supply? Could further declines in home prices push the economy into recession?
While my own answer to the above is "no," we cannot ignore that all this is adding to uncertainty.
Highlights from Poole
St. Louis Federal Reserve President William Poole gave a speech in St. Louis today on the state of the economy. I am looking at this as a preview of Bernanke's congressional testimony on 2/14. Here are some highlights.
He is upbeat on the economy, and believes the housing market is at or near a bottom:
"My own take on what “moderate pace” means is that real GDP is likely to increase by roughly 3 percent over the four quarters of this year—particularly if the housing market is near an inflection point and no longer a significant drag on growth."
His next statement is key, as it emphasizes the view that monetary policy is just right where it is.
"But I want to emphasize that fluctuations in growth are normal and that no policy action is necessarily indicated if growth comes in somewhat above or below that outlook. When data come in outside the range expected, we need to understand the reasons and the likelihood that the departure will be sustained unless there is an offsetting policy response. Only then does it make sense to consider a policy response."
So while the Fed says its data dependent, that doesn't mean the next piece of data is likely to push them to change rates any time soon. In fact, if we take this statement at face value, it sounds like Poole's predilection is to leave rates exactly where they are until a series of data points come in which establish a direction.
Poole also drops the following statement...
"...monetary policy can affect only prices and not quantities in the long run"
... in a very matter-of-fact way. Unfortunately, too many in the financial markets don't understand the consequences of that statement. He is saying that the Fed cannot engineer real growth using monetary policy. So those who expect to see the Fed cut several times over the coming quarters should consider such statements and ask themselves whether the Fed's own words are consistent with their outlook. Even if the weak growth they predict comes to fruition, will the Fed react the way they expect?
From the ridiculous to the sub-prime
Mortgage lending stocks got pummelled yesterday, particularly companies involved heavily in the sub-prime market. It all came on the heals of a report from HSBC that they may have to set aside an additional $1.8 billion to cover sub-prime loans going bad. If you are wondering how HSBC became such a player in the U.S. sub-prime market, remember that they bought Household Bank a couple years ago. I had to laugh when I read in HSBC's release that fraud incidents were higher than they expected. According to Bear Stearns, 49% of sub-prime loans made for home purchases where of the so-called "limited doc" type, which means the borrower could not document his/her income. So borrowers with poor credit to begin with are coming to a bank to borrow money, but claim they cannot prove their income. And HSBC is surprised there is a fair amount of fraud there?
What does this mean to the bond market? Bonds backed by sub-prime loans have been getting killed. The BBB ABX-HE 06 index (which tracks BBB-rated home-equity loan pools originated in 2006) was trading above $101 as recently as December, just closed at $95.45. The next shoe to drop will be ABS CDOs.
A CDO (collateralized debt obligation) is a derivative structure where investors can buy different slices of credit risk on a large portfolio. The most junior tranche takes all losses until it is completely wiped out, then the next most junior tranche gets hit, and so on. At the very bottom of the structure is the equity holders, the actual owners of the portfolio. CDOs are created backed by various types of credits: from bank loans to CDS contracts. But ABS-backed deals tend to be the most levered: the equity is commonly only 1-2% of the entire deal size in ABS deals. So the equity holder has something on the order of 100x leverage.
These deals are structured to produce large returns for the equity holder if defaults are relatively low and spread out over time. But we can imagine that the nationwide housing downturn coupled with overly aggressive lending standards will lead to a larger number of defaults concentrated in a small period of time. This is not something a lot of ABS-backed CDO deals can handle. Not only will the equity holders lose all their principal, but if losses are severe enough, even the most senior tranches will start to suffer losses.
Unfortunately, this could wind up tainting the entire CDO market. Which is too bad, because CDOs are a great way for investors to express a specific view on credits. With a CDO structure, an investor can buy into a diversified portfolio of high-yield bank-loans, but instead of having a series of B and BB-rated bonds, they can buy an A-rated tranche, taking comfort in the fact that if the portfolio experiences some losses, there are probably 2-3 tranches junior to the A-rated piece.
CDOs went through this before. In 2001-2002 many deals backed by high-yield bonds imploded. The market recovered nicely to where it is today, but now deals backed by entirely high-yield bonds are extremely rare. The same fate could befall the sub-prime ABS market, and will have a long-term impact on spreads in that market.
Thursday, February 08, 2007
A sensible idea that both the left and right should like... so it won't happen
Use of fossil fuels has externality costs. There is overwhelming science that fossil fuels are contributing to global warming at least to some degree. In addition, our use of oil has a profound impact on our foreign policy and military needs. I don't need to go over this here as it has been covered extensively elsewhere.
The best way to solve an externality problem is to force those who consume the product to pay society for the externality costs. Not only does this better match those who consume the good and those that pay for it's overall cost, it also encourages those that have choices to choose something with fewer externatility problems.
So why not tax use of fossil fuels? A new survey of economists conducted by the Wall Street Journal shows that a majority of economists surveyed support this idea. While not exactly laissez-faire, its a hell of a lot closer than mandating better fuel economy or particulate standards. Its a lot more free-market than subsidizing ethanol. For environmentalists, a tax on fossil fuels would do more to encourage development of alternative energy than all government research grants to date combined. The tax wouldn't have to weigh on the economy, the government could simultaneously lower personal and corporate income taxes. Think of it, corporations that use little fossil fuels get a big tax break, and those that do use them are strongly encouraged to come up with an alternative. People who ride their bikes to work get a big tax break. Those that drive big SUV's 50 miles a day are encouraged to make changes. If these people or corporations can't or won't change their consumption, then they will bear the cost. All without complicated and heavy-handed regulation that corporations will just find a loop-hole around anyway.
Sounds like an idea the left and right could both agree upon. Too bad congress doesn't seem to be listening.
Wednesday, February 07, 2007
What's the liquidity premium for corporate bonds?
Sometimes I'm a bit slow. But I've finally made a connection which I think is an important one.
A recent study suggests that liquidity in the corporate bond market has improved. I wrote about this study back in September. If this improved liquidity is real and permanent, what is the impact on spreads overall? First, some quick background on liquidity.
In a recent discussion in the comments section on TIPS, one commenter pointed to an academic study suggesting that illiquidity in TIPS explained some of spread vs. Treasuries. Liquidity, here measured by the bid/ask spread, is worth something to every investor. A tight bid/ask means that the transaction costs of entering and exiting a trade are low. The more often you trade, the more important the liquidity of your item is.
Since liquidity is valuable, a relatively illiquid bond should trade with a higher yield than a similar bond with better liquidity. On-the-run Treasury bonds have the best liquidity in the U.S. market, followed off-the-run Treasuries, TBA mortgages, large issue non-call agencies, and large issue high quality corporates. With corporates, the liquidity can be very name-specific.
Measuring the liquidity premium isn't easy, and the premium is probably not constant. For example, the difference in yield between the on-the-run Treasuries and the nearest off-the-run issues is about 9/10ths of a basis point right now. There we have two items with exactly the same credit and interest rate conditions, but a slight difference in yield entirely because of liquidity. While this is irrefutable evidence that there is a liquidity premium, the bid/ask difference between on and off-the-run issues is a mere 1/64th of a point (called a "plus").
More information can be gleaned from the agency market, e.g., Fannie Mae and Freddie Mac. Both are considered to have extremely strong credit quality and perhaps even have the implicit backing of the U.S. Treasury. The most liquid 10-year agency issues trade with around 4.5 ticks bid/ask, or about 4 ticks more than the 10-year Treasury. These issues offer about 32bps of extra yield over Treasuries. How much of this can we attribute to credit quality and how much to liquidity?
The best way I can think of is to compare TBA Ginnie Mae MBS to Fannie Mae MBS with the same coupon. In the TBA market, both have the same bid/ask, but Ginnie Mae is explicitly U.S. government guaranteed. The difference between the two is currently 17 ticks on the 5.5% coupon. The theoretical difference between an agency and Treasury measured in dollar price is 81 ticks (2.5 points). So 64 ticks, or exactly 2 points, is attributable liquidity differential between Treasuries and Agencies. In yield terms, that implies that the liquidity premium for agencies is 25bps.
So where is all this going? If all of my analysis above is correct, then a market where the bid/ask tightens by 4 ticks will see the overall spread of the issues contract by 25bps.
Back to the study I mentioned at the onset of this piece. It claims that the average bid/ask (quoted in spread) is now 8bps tighter than it was in 2002. That's about 20 ticks on a 10-year issue. If my estimation is correct, that should have allowed corporate bonds to tighten by 125bps entirely due to liquidity. Since June 2002, investment grade corporate spreads have contracted 149bps.
Now, let's step back. We've come up with 125bps of tightening by building a tower of assumptions. Notably, 2002 was period of particularly poor liquidity, as we were still coming out of the Enron/Worldcom scandal period. So the researcher's estimation of 8bps of bid/ask tightening might be biased based on the measurement period. Regardless, there is not one sell-side trader or experienced bond salesperson who does not say that the bid/ask has tightened from where it was in the late 1990's. So maybe its 8bps, maybe its 5, maybe its 3, whatever. It is still a very large influence on spreads.
What are the trading consequences of this? Take another look at the graph I published on Tuesday. High-grade spreads are only 19bps tighter than the long-term median. If the bid/ask has permanently tightened by a mere 2-3 bps, the overall spread market should have moved more than 19bps tighter. In my 2007 forecast, I said I'd be long investment grade corps vs. Treasuries, because while they might widen slightly, it wouldn't be enough to overwhelm the yield advantage. Now I'm wondering if the performance might actually be even better...
Tuesday, February 06, 2007
U.S. Corporates: How tight are we really?
Serena Ng has a piece in today's Wall Street Journal titled Bond Boom's Thin Ice, which focuses on tightness in the high-yield bond market. Its conventional wisdom that corporate bonds in general are extremely tight, but take a look at the actual numbers and you might find they aren't as tight as you thought.
Here is a 10-year graph of corporate bond spreads using the OAS of the Merrill Lynch Corporate Master and Merrill Lynch High Yield Master.
The high-yield spread is on the right axis and the investment grade spread is on the left axis. The dashed line represents the median spread. Some interesting points jump right out at you. First, if you correct for scaling, the high-yield and investment-grade spreads are very highly correlated, and the median spread is almost exactly in the same spot.
While both series are tighter than the median spread, the deviation between the median and current spread is much greater with high-yield. The investment grade spread is 19bps tighter than the median (88bps now vs. 107bps median). The high-yield spread is 167bps tighter than median (267bps vs. 434bps). The investment grade spread is currently in the 20th percentile while the high-yield spread is in the 11th percentile. We see that historically, high-yield spreads have been about 4x investment-grade spreads. Right now that figure is barely over 3x, and is the tightest ratio in this series.
So anyone trying to explain why credit spreads are tight needs to explain why high-yield has outperformed investment grade so severely. I don't think strong economics or more conservative balance sheets can explain it. First, there is a large contingent of investors who expect weaker economics in the next 1-2 years. And its almost universally assumed that shareholder friendly activity, such as LBO's and stock buybacks, will erode at least some of the balance sheet strength currently enjoyed.
I think the answer is new demand. The advent of CDS and rise of hedge funds as the dominant force in the corporate bond market are helping spreads. But hedge funds are merely a symptom of the real problem: too much liquidity. Blame the Fed, blame the ZIRP, blame China's over saving. Blame whatever you want. When too much liquidity is available, that cash has to go someplace. High-yield isn't the only place its winding up, but its perhaps one of the places regular investors are most likely to get hurt when the liquidity is finally squeezed out.
Monday, February 05, 2007
Can't get enough of TIPS
A quick comment on why I started this blog. First, I have a gigantic ego, so I think that my opinions and commentary are worth other people reading. Second, I have an insatiable desire to do things myself and/or create new things. By this I mean, when I started reading investment blogs regularly, I rapidly concluded that I had to start one myself. Third, I didn't know of any blogs that focused entirely on the bond market from a trading perspective, and the blog world is all about specialization.
But probably most of all, I thought doing this would challenge my thinking. Force me to prove my ideas to such an extent that I could convince my readers. I knew that my blog would attract mostly pros, students and serious investors; who else would read this arcane stuff? So I knew if I were going to attract a loyal readership, I'd have to produce quality posts with well-reasoned arguments. I knew doing so would make me a better trader.
So thanks to all the people who have posted comments on my recent pieces about TIPS. For those who haven't already, I encourage you to go back to these posts (here, then here, then here) and see the argument unfold. We don't get many comments on this blog, which probably owes to the type of material I write about and the people who read the blog. But most of the comments we do get are in-depth and thought provoking, and that's what it should be all about.
Anyway, here are some additional comments about TIPS. I can't say they are "final" comments, because this is a debate that will continue to rage on regardless of what I say here.
1) TIPS will obviously outperform Treasuries if inflation is higher than is currently priced in over the term of the bond. Therefore if TIPS and Treasuries are your only choices, and your inflation forecast is greater than the spread between the two, buy the TIP.
2) Bear in mind that food and energy account for most of the variance in inflation figures. Therefore in order for your inflation forecast to be correct, you better have a good forecast of oil prices.
3) As I have stated a couple times, I invest based not on predictions but probabilities. I can't get to a place where my forecast for inflation is definitive enough to invest in TIPS given current spreads and given the analysis I did here. Particularly since I believe the Fed is pretty good at fighting inflation, and any spike in CPI that is not related to oil prices will be beaten down by tighter monetary policy.
4) I believe there is a "special" bid for TIPS from asset/liability matchers who have CPI-based liabilities. I think this results in TIPS being more expensive than would be in a theoretical efficient market where all agents are motivated solely by profits.
5) I don't believe in the blanket statement that any asset class with a less-than-1 correlation should be included in a portfolio. Not only is this practically impossible, but there are many types of bonds which exist to meet specific needs and/or have a "special" bid. The most egregious example would be tax-exempt municipal bonds. Introducing these bonds into a non-tax paying portfolio would be silly, and yet the CAPM extended to its logical conclusion would have you do just that. I doubt very seriously that the creators of this theory would advocate holding tax-exempt bonds in a non-tax paying portfolio. I'm not trying to contradict a Nobel prize winning theory, I'm saying that the theory makes a series of assumptions that don't hold in real life. So treat CAPM as what it is: an idea about how to build a portfolio, not as an actual strategy.
Friday, February 02, 2007
Accrued Interest has TIPophobia
My recent post on my aversion to TIPS resulted in a torrent of comments. OK, 10. OK, half of them were mine. OK, so we don't get a lot of comments here at Accrued Interest. Anyway...
I thought we'd do a little investment math on the subject, and really get down to it. Now, I normally try to avoid lots of formulas on this blog, because people hate to read that shit. But in real life, the math is what bonds are all about. If you follow closely to what is written below, you will see exactly why I don't buy TIPS.
Based on Bloomberg's survey, the median prediction from economists for CPI in 2007 is 2.0%. So we'll use that as a baseline. First I'll compare a 10-year TIP vs. a nominal Treasury bond. To make things easy, we'll assume that real interest rates don't change. Nominal interest rates will change based entirely on shifts in inflation. We'll run inflation as 1%, 2%, and 3%. We'll also run a 1-year horizon.
Inflation Rate = 3%: TIP 5.32%, TSY -1.88%
Inflation Rate = 2%: TIP 4.42%, TSY 4.82%
Inflation Rate = 1%: TIP 3.47%, TSY 11.89%
AVERAGE = TIP 4.40%, TSY 4.94%
So if you have equal views on inflation, the TIP is the wrong investment. But if you have even a small view that inflation is more likely to rise than fall, the TIP might make sense. In fact, the weighting to the higher inflation scenario needs to be just 38% to even the score.
Now, let's assume the Fed gets involved when inflation changes. Of course, why inflation changes is a significant question here. If energy prices are weak, and it causes CPI to print low, the Fed might not do anything. But for the sake of argument, let's assume that the Fed hikes 100bps in the 3% scenario and cuts 100bps in the 1% scenario. In both cases the effect on 10-year rates will be exactly half that of short rates. I.e., real rates shift by 50bps in addition to the inflation effect.
Inflation Rate = 3%: TIP 0.95%, TSY -5.11%
Inflation Rate = 2%: TIP 4.42%, TSY 4.82%
Inflation Rate = 1%: TIP 7.52%, TSY 15.56%
AVERAGE = TIP 4.30%, TSY 5.09%
The average difference in return is 79bps. But you only need to increase the weighting of the 3% scenario to 41% for the trade to be breakeven on average.
But we live in a world of choices. Instead of buying the 10-year Treasury by itself, what if you added a 50% position in a floating-rate bond? Again, assuming the same Fed action. We'll assume the Fed moves quarterly, the FRN resets at LIBOR flat, that LIBOR moves exactly in line with the Fed, and starts at 5.30%. Here are your returns.
Inflation Rate = 3%: TIP 0.95%, TSY/FRN 0.28%
Inflation Rate = 2%: TIP 4.42%, TSY/FRN 5.06%
Inflation Rate = 1%: TIP 7.52%, TSY/FRN 10.24%
AVERAGE = TIP 4.30%, TSY 5.20%
The breakeven probability for the 3% inflation scenario is 72%! That means that unless you view the 3% inflation scenario to be more than 72% likely, you are better off owning a combination of floaters and traditional Treasury bonds.
But wait, it gets better.
Remember that if your economic forecast is for more inflation, its entirely possible that the Fed recognizes the problem early enough to prevent any actual inflation. The result would be that rates rise, but the rate hikes mute and/or prevent any acceleration in inflation. In that case, the real rates impact on both the TIP and Treasury would be the same, but your FRN position performs extremely well.
Also, bear in mind that we've only run a 1-year scenario. Let's say that at the end of 1-year the inflation spike has resulted in several Fed hikes, but the market now figures inflation is whipped. So while you got a year's worth of extra inflation-adjustment on your TIP, when you go to sell the thing, less expected inflation is priced in, so you've suffered some price loss there. Meanwhile the TSY/FRN portfolio has performed much better, because the subsiding of inflation pressure has allowed the Treasury to appreciate (or not depreciate as much), while the floater is benefiting from higher short-term rates.
Finally, it tends to be that the curve flattens as the Fed hikes rates. The classic play on a curve flattening is to own a position in longer bonds and a position in floaters. So the TSY/FRN portfolio benefits from this tendency as well.
If you view inflation as incipient, floating-rate bonds are a good investment. They perform well whether short-term rates rise because of Fed activity or actual inflation. The weighting you give floaters in a portfolio depends on how aggressive you want to be with your inflation bet. In this piece, I gave the example of a very simple portfolio with just 10-year Treasuries and floating rate notes. In reality, you'd probably own various bonds, but you'd probably do well to make something of a barbell out of your portfolio, increasing the 10 yr+ bucket and the >1 year/FRN bucket.
Unless you have a very specific view of inflation/Fed activity which you want to play, or you have a CPI-based liability to match, I don't think TIPS are the right investment.
Can someone please welcome Barney Frank to the 21st century?
Macroeconomics has come a long way since 1913, the year the Federal Reserve Act was passed. John Maynard Keynes' career was just getting started. Milton Friedman had just been born the year before. In fact, I'd wager that very few major theories pertaining specifically to macroeconomics that are still widely held today were developed before 1913. And yet, 1913 is the year the dual mandate for the Federal Reserve Bank was codified.
Macroeconomics has also come a long way since 1981, the year Barney Frank took office. This time not so much in terms of theory, but in practice. The U.S. was coming off two consecutive years of double-digit increases in consumer prices. The most recent presidential administrations thought price controls and jawboning would solve the inflation problem. Recent Fed chairmen Arthur Burns and William Miller seemed powerless to control inflation. Burns in fact believed that the Fed could not tighten monetary policy at a time when unemployment was rising, regardless of what prices were doing, as the population would not accept high levels of unemployment under the auspices of controlling inflation. So when both unemployment and inflation were on the rise in the 1970's, the Fed did very little.
For those of us in the investment business, and I'm sure for professional economists as well, 1981 must seem like another world. Many of the ideas that were given serious consideration (or even implemented) then to fight inflation would never be contemplated today. Paul Volcker and Alan Greenspan have proven through practice that controlling inflation and creating a more predictable inflation/interest rate world is better for everyone. It is also now widely held that the Fed has very little ability to improve unemployment in the short-term. While the Fed can increase the money supply to help alleviate a credit crunch or to prevent deflation, both academic research and the experience of the 1970's shows that easy money does not decrease unemployment.
Today, we hear Fed officials routinely state that the best way for the Fed to meet its dual mandate is to keep inflation low and stable. This allows business and consumers to plan better, and reduces the risks in the economy. That in turn allows more people to be employed.
The Wall Street Journal has an article today on inflation targeting, something I've been convinced is the right move for the U.S. central bank. Unfortunately, politicians like Barney Frank, who is chair of the House Financial Services Committee stand in the way. Even if you don't agree with me on inflation targeting, its pretty well settled that the Fed's dual mandate is best served by focusing on the "price stability" part and allowing the "maximum employment" part to resolve itself. If the economists at the Fed, who by all accounts are among the world's best in their field, say that an explicit inflation target is the way to achieve price stability, then why should a lawyer turned politician like Frank stand in the way?
Frank is widely considered among the most liberal of major U.S. politicians, but I don't see this as a liberal vs. conservative issue. Arguing that the Fed controls unemployment today is a little like debating whether steroids was pervasive in baseball. There may have been a legitimate case on both sides at one time, but now the answer is clear and well settled. Even if you once held the opposite position, the evidence now is so overwhelming that to continue clinging to your former position shows a lack of intellectual honesty.
I have no doubt that Barney Frank is a highly intelligent human being. So is Paul Sarbanes, who constantly argued a similar position from the Senate. I know there are other congressmen and women who have the same view as Frank. But it is both comical and frightening that such powerful people can be so misinformed about such a critical subject.
Thursday, February 01, 2007
Forecasting your own actions...
Forecasting is extremely hard. Even when the forecast is of your own actions. Consider how accurate you'd be in predicting what you'll be having for dinner next Sunday. Its an activity which you probably have full control over, and yet there are too many variables and too many decisions between now and then for most people to make an accurate prediction.
An article in the Financial Times highlights a similar problem, albeit one with much more consequence. I found the link courtesy of Macroblog. The article includes a chart of where actual central bankers in New Zealand predicted they would be setting rates in 3 months time. The bottom line is that the banker's predictions seem to be of little value. And the reason why is fairly obvious, there are just too many variables in economics for any prediction to be particularly accurate.
In my time as an investment manager, there are a few core tenets in which I have come to believe very strongly. The italicized statement above is one of them. No matter what the prediction, no matter who the forecaster is, and even no matter what special information s/he might have, any specific economic forecast has a low probability of being accurate.
What's the consequence of this? How does realizing and accepting this make you a better investor? It isn't just about hedging and/or limiting the portfolio bets you make. That might reflect proper investment thinking, but it might also reflect indecision or cowardice.
The right reaction to the fact that forecasting is so difficult is to think of your own forecasts in terms of possibilities rather than predictions. This is something I wrote about in more detail earlier in the month, in conjunction with my 2007 Forecast post. You may have a particular forecast that you think is most likely, but you should have alternative forecasts which you view as reasonable possibilities. You should then build a portfolio that will perform well in various possible scenarios, if possible. Or else build a portfolio which will perform very well in your most likely scenario, but perform at least fairly well in other scenarios.
Note that this is not the same as simply limiting your portfolio bets. For example, at the beginning of 2007, I thought rates would shift slightly higher and the curve would steepen as the Fed cut only 1-2 times. I also thought there was a possibility that the economy slipped into recession and the Fed cut several times. While my primary forecast was for higher rates, my secondary forecast was for drastically lower rates. Therefore a duration bet is a tough one, because my payoff was small if the first scenario came about, but my pain was large if my second scenario emerged. So I looked to make a larger bet on the curve steepening. I'm willing to make this a large bet, because in both of the most likely scenarios I see, the curve steepens. So not only have I positioned my portfolio in the middle of the curve, I've put on a non-inversion position, and I've loaded up on MBS, which tend to perform well in a steepener.
My MBS stance is another example of how you just limiting your bets is the wrong way to go about it. I'm heavily overweight MBS. The MBS position performs well when rates are fairly stable, which means that if my primary prediction is correct, MBS will be a big performer. I own mostly discount MBS, so if the Fed cuts aggressively, I should see significant prepays on a discounted item. Even more aggressive is my play in discount hybrid-ARMS. There borrowers should use any period of Fed cutting as a chance to reset their fixed (or even IO) period and stave off the ARM portion of their loan. So the discount hybrid-ARM play is a home run if we have a bull steepener. And if none of this happens, I just ride the extra carry off into the sunset.
These are just some examples of how you can make a series of aggressive plays but still wind up performing well in various scenarios. Contrast this with the more common approach of just limiting portfolio bets. The result there is mediocre performance no matter what. I just don't think that's what clients pay investment managers to produce.


