Friday, October 30, 2009

Don't get technical with me! 10/30/09

I think whenever we are using technical analysis, we have to remember why it might work. Charts and patterns aren't some mystical energy field that controls the market's destiny. Its merely a means of gauging the market's mentality. Take a very simple indicator like the MACD, which is one I like a lot. All it basically shows is whether the 2 week moving average is lower or higher than the 1 month moving average. What does that tell you? Merely that price gains (or losses) are accelerating. In other words, is there momentum?

There is solid logic to the idea that stocks might follow a momentum-type pattern, that is that market participants won't all draw the same conclusion about a stock at the same time. Some will buy in early and some will buy in later. If IBM stock has positive momentum, maybe that means more and more people believe the company is executing on its strategy.

From a technical stand point, if positive momentum develops, that might be an indicator that some early adopters are buying the stock. You can buy in hoping that others will follow those early adopters.

This is a simple way of seeing how a chart can reveal something about how the fundamental side of the market is behaving. That is exactly where I think technicals can help one trade effectively. Often when I consider the fundamental picture, I can see good arguments on both sides. By using technicals, you can often find which argument is winning. This can help you better execute a fundamental view. If you want to be long, but see momentum building on the other side, perhaps its better to wait for another entry point.

One could say that technical analysis is trying to front-run fundamental investors. Momentum is one example, as illustrated above. Something like RSI is another. When a stock becomes over-bought, its logical to say that fundamental buyers may choose to take profits.

Where I think technical analysis breaks down is when it gets overly complicated and loses all connection with fundamentals. Elliot Waves, and seasonals are two that some immediately to mind. I roll my eyes whever I read something like "June and July have been good months for bonds 7 of the last 10 years."

Anyway, let's get to it. I've been touting 3.48% as a good support level for two weeks now, but it doesn't look as strong after having been broken materially.


In fact, it looks like a solid upward trend (in yield) has been formed. Here is the closing yield chart...


Looks like we need to hold around 3.45% to keep the trend in place. So 3.45% would be a good entry for a short, especially if we manage to close slightly higher than that today (in yield) today.

Here is the bar chart in price on the current 10s. I've tried to draw the lines between intra-day highs/lows (red) and the close high/lows (green).
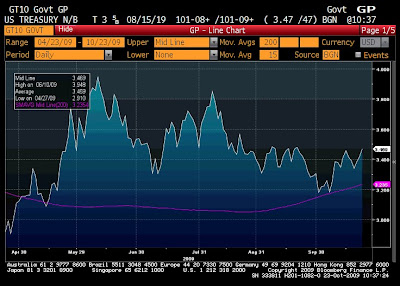
Confirms the yield chart, I think. And since I mentioned the MACD above, I figure I have to throw it in here. Momentum still sharply negative.


So I think you enter a short. If you want to be aggressive (which I am), do some at 3.45% if we hit it today, then add if we close at 3.46% or above. The stop would be if we close at 3.43% or lower yield, indicating that the trend might be broken.

Thursday, October 29, 2009

Look, I had everything under control until you lead us down here!

Credit trading got very ugly late last night. Sellers were showing up in force, buyers were all but extinct, the street was taking its reward and leaving. Here are a few sample quotes from traders describing the afternoon's trading conditions:

  • "Wheels coming off in finance spreads"
  • "Retail flows skewed 70% to the sell side"
  • "We're testing the liquidity thesis"
  • "Liquidity non-existent"
  • "Market clearing spread levels uncertain as sellers unable to find buyers"

Is this a inflection point? Are spreads headed wider? I'd like to think so. My models are pointing as bearish as they've been all year and I've thus moved into a bearish credit stance. However I have to admit, we've been here before. Several times over the last 6-months we've suffered through a day or two of real ugliness only to snap back. The real money back bid has (so far) always been there.

This morning it looks like the back bid is showing up again. Overnight I'm hearing credit traded well in Europe and bank spreads are opening 3-5 tighter.

The thing is, credit spreads are in a very precarious position, especially high-grade spreads. The carry trade has been a key driving force of the spread rally. Its not the only positive force, we have had some real economic improvement since last winter, but clearly ultra-easy money has helped to fuel demand for spread product.

So now which path do we start down? If economic data starts coming in stronger, if job losses abate and consumer spending keeps increasing, then the Fed will hike rates. That will be negative for spreads. If economic data comes in weaker, then maybe the Fed stays accomodative, but fundamentally spreads would probably start moving wider.

Admittedly, always in motion the future is. But how can credit spreads move much tighter near-term? Difficult to say.

Wednesday, October 28, 2009

A useless gesture, no matter what technical data they've obtained!

In my last 10-year trading post, I wrote that while momentum was negative for Treasury prices, we were sitting on a key support level, leaving the direction highly uncertain.

On Monday, 10's pushed through support at 3.48%, offering an entry for a short. I made a small short at 3.50% using TBT ($47.24). I was at 1/3 size. I figured I'd pile on if the 2-year auction stunk. I looked like a genius for about 4 hours. Then on Tuesday we rallied away most of my gain and the strong 2-year auction pushed the 10-year back through the 3.48% level. I sold TBT within seconds of the auction at $47.21.

Now we're extending the rally with 10s at 3.41%. If I were forced to pick a direction I'd guess we keep rallying into the low 3.30's, but of course the 5 and 7-year auctions could go poorly and completely upset that. My plan is currently to let it keep rallying and then re-set a short, most likely in front of the 3-10-30 auction cycle next week. I might fool around with trading right around the auctions today as well, but those will be very small sizes if I do it at all.

Tuesday, October 27, 2009

Too Big to Fail: Cut the chatter Red Two!

Yesterday's report on CNBC is that Congress is nearing a bill on new financial regulations aimed at the Too Big to Fail problem. The details are vague, but the crux of it is that the government wants the power to wind down failing financial institutions much in the same way the FDIC has the power to unwind failing commercial banks.

(FYI, very nice piece over at Economics of Contempt on TBTF, which I recommend. I'm not going to cover much of the same territory here, but he makes a lot of great points.)

Here are my basic concerns. First, we cannot wind up with a banking regulatory scheme that focuses on hard targets for anything. Systemic importance can't be measured just by assets. State Street and SLM Corp have about the same asset level, but the former is much more systemically important than the later. Or what about a firm like Ambac? Ambac's asset level peaked at only $24 billion, but certainly it had more systemic importance than its size suggested. I'm not sure it would rise to the level of Too Big to Fail or not, but I think we'd all agree that while size may matter, it isn't everything.

Not only is there no single number for systemic importance, there also isn't any single calculation that will measure effective risk a financial firm is taking. We know in the recent crisis that Citigroup had all sorts of off-balance sheet risks. As of 2007, Citi had a Tier 1 ratio of 7.1, but its effective leverage was much higher than that.

And its not all about leverage either. Look at Lehman. They had a Tier 1 ratio of 11 just weeks before they were bankrupt. Their problem was part their funding mix which was very reliant on repo and prime brokerage, and part the fact that the market didn't believe their valuations on some illiquid assets. Maybe had either of those circumstances been different, i.e, the same leverage and assets but a more stable funding mix, they would have survived. Regardless, a regulator scheme based on leverage ratios never would have caught Lehman before it was too late. Nominally, they had plenty of capital.

We also don't want a scheme which is overly focused on routing out bad lending. I say this because I have as much confidence in regulators judging loan quality as I do Chancellor Valorum. In fact, my suspicion is that regulators will likely spend most of their time fighting past wars. So if we assume that there will be another period where lending standards become dangerously weak (which there will be), we should also assume that regulators won't be able to foresee the problems and stop them before they start. Put another way, there will be spilled jawa juice. You can't prevent it. We need to be able to clean up the mess a lot better than we did this time around.

One of the problems we had this time around was that for a long while there was very little differentiation between bad banks and not-so-bad banks. For example, if we go back to November of last year, a bank like M&T Bank would have had a very hard time raising fresh equity capital. Did M&T make some lending mistakes? Sure. But by being completely shut out of the equity market, didn't that basically make M&T no different than a bank like National City? Or even better, could Wells Fargo had realistically sold new equity in February when every one was talking nationalization? Again, did Wells make some lending mistakes? Absolutely. But is it healthy for the system for banks to be viewed as so black and white? Back then it was good or bad. Whereas in reality, every bank was grey.

Let's take it as a given, just for a moment, that M&T Bank had an above-average quality portfolio. I'm just using them as an example, I don't really know M&T's portfolio that well. Why did they have so poor access to the capital markets? The stock market presumed that all banks would need to raise capital or else they would be driven under (or nationalized) by regulators. So bank stock prices kept falling and falling, making any realistic capital raise harder and harder. No one benefited from this self-fulfilling prophesy.

This example illustrates that we don't want a system that forces access to the capital markets as a pre-condition to survival. The stock market will run ahead of the potential capital raise, making it more and more painful. In fact, one could argue that's what happened with Lehman. The falling stock price basically dared Dick Fuld to try to gut it out without any additional capital. Again, no one benefited from this scheme.

This is why the idea of contingent capital makes so much sense to me. A bank has a ready set of equity investors whenever its needed. It instills market discipline, as the current stock price would reflect the potential for dilution, but the falling stock price wouldn't prevent a capital raise. In effect, this is a little like a standard bankruptcy, where bond holders take control of a company, except that instead of the company actually going through such a disruptive process, ownership just transfers (in part) to the contingent capital bondholders automatically.

We'll undoubtedly spend a lot of time on this subject in the coming weeks and months and I'm sure it will feel very much like a moving target. I can't wait.

Monday, October 26, 2009

Bonds and the U.S. Dollar: Use the commlink? Oh. I forgot. I turned it off.

Call me a sucker for the classics. Be it the original trilogy, the old Kenner figures, the "Nyub Nyub" song at the end of Jedi, or the classic theories of exchange rates. While the old classics, like interest rate parity or purchasing power parity, may not exactly fit reality (especially not in real time), I think the concepts remain useful. That is to say that as inflation rises, a nation's currency should depreciate. As interest rates fall, suggesting that there are few good local investment opportunities, the currency should similarly depreciate.

I wrote several weeks ago that the dollar should depreciate for exactly those reasons (I even made the same classics joke). The U.S. should have higher relative inflation vs. other countries, and the Fed would likely hold U.S. short-term rates lower than other countries.

A corollary to the above discussion would suggest that bond yields should normally be inverse correlated to the dollar. If the dollar is falling because inflation is rising, that should also be reflected in higher bond yields.

Or if you want to make a deficit-based argument for a weaker dollar, to which I don't ascribe, but either way, it would still suggest that weaker dollar = higher bond yields. If the deficit is causing a flight from U.S. assets, then Treasury prices should fall as money flows out of the U.S.

Indeed, that is exactly the pattern you saw for the first half of this year.


Lower dollar coincided with higher bond yields. Exactly what we'd expect.

But then a funny thing happened on the way back to normal. Like Zam Wessel, The dollar/bond relationship went completely the other way.


What's going on here? The dollar gets weaker, bond yields fall?

It traces back to why the dollar is falling. Unfortunately we're going to have to get away from the classics and consider what's going on right now. Right now, the U.S. is the cheapest place to borrow money anywhere in the world. If you are a non-dollar entity, whether you are a government, central bank, insurance company, etc., your cheapest source of funds is anything U.S. LIBOR-based. You can borrow in dollars and re-invest in something local to you. That's dollars flowing out of the U.S., thus pushing the dollar weaker.

Meanwhile if you are a U.S.-based investor, your cheapest source of funding is still something U.S. LIBOR-based. Remember that banks are still sitting on huge deposit bases and are either unwilling to lend or unable to find worthy borrowers who want credit. What do they do with their deposit base? Invest it in bonds! If your borrowing cost from the Fed is 0.12% (approximately where Fed Funds is trading), you can buy 2-year notes at 1% and make tremendous carry. Just take a gander at the recent bank earnings. The NIM's are huge.

When is the Fed going to take away the bowl of Aunt Beru's famous blue milky looking punch? According to a recent story from the Financial Times, maybe sooner than we think. I had long thought that a Fed hike was a long way away but as consumer spending starts rising, the risk of inflation returns. Now it seems like some number other than zero is probably the appropriate funds rate.

Plus it would be nice to think that the Fed realizes how zero Fed Funds is impacting financial markets and the potential, potential mind you, for it to create dangerous distortions. Whether they actually do realize this or not is any one's guess.

Friday, October 23, 2009

Don't get technical with me! 10/23/09

Say what you want to about next week, it will be interesting.

To start off, momentum remains solidly negative, although the bars show declining intra-day vol recently.


The 10-year is sitting on what I think is strong support at 3.48%.

Next week we get a ton of new auction supply. $7 billion in 5-year TIPS on Monday, $44 billion in 2-years on Tuesday, $41 billion in 5-years on Wednesday and $31 billion 7-years on Thursday.

I predict the auction results will be weak, especially for the 5 and 7-year bonds. Lately how well auctions have gone as been a function of whether foreign demand shows up in force or not. This isn't a comment about the long-term foreign demand for U.S. debt. Rather an observation that central bank demand in particular is notoriously fitful. They need bonds one week, they don't the next.

Last week saw very heavy buying from east Asia and Russia. I am willing to bet that will mean less demand at next week's auctions. In particular the 7-year, since I heard that was where they were buying.

Auctions don't guarantee lower bond prices. Here is a chart from the last 2-week Treasury auction binge (9/22-10/8). Yields basically moved straight down for the first week (the 2-5-7 year cycle) then were sideways for the second week (the 30-year was especially poor).

So one could make a case for a long here, maybe a good 2-year auction allows us to bounce off support at 3.48%. I'd think the next resistance would be around 3.30%, which is a level we've hit several times and also about equal to the 200D SMA.


So what's the play? I don't like an outright short right now. Especially given today's action. Sharply lower stock market with a lower Treasury market? Sets up for a big rally given even a modestly good auction. I view days like today as having latent Treasury demand.

Better to play this contrarion. Wait to see how the 2-year goes. If it goes well, look for an entry for a short and play it back to 3.48%. That would require a very tight stop. Or if it goes poorly as we break through 3.48%, then you ride that up to 3.71%, where I think the next resistance point is.

The other play is buy TIPS ahead of Monday's auction. Word on the street is that the primaries are begging the Treasury to issue more TIPS, but instead the Treasury decreased the size of the 5-year auction! I'm buying TIP here at $103.20 with a target of $104.28, stop at $102.85

Thursday, October 22, 2009

Bank Loss Reserves: Not an easy challenge

With most of the big banks having reported 3Q earnings I wanted to take a look at how we're progressing with loss reserves. Unfortunately, I did not find good news.


Here's what I did. I took a look at Wells Fargo, J.P. Morgan and Bank of America. All three reported a decent breakdown of their loan exposures by type. (Click on each name above for their earnings presentation). I then took the loan loss estimates used by the Fed in the stress test and multiplied each bank's exposures by the loss estimates. Note that the Fed basically had four loss estimates. They had a "Baseline" and a "Adverse" scenario, then they had a high and a low estimate within each of those.


Then I compared that loss estimate with the combined loan loss reserve and current write-downs the bank has taken. This analysis is far from perfect. Each bank reports things a little differently, so I had to make some judgements. Plus who really knows whether the Fed's SCAP estimates for loan losses are right. Still, the Fed's guess is as good as any, and the exercise should be illustrative of how close we are to the end of loan loss provisioning.


Alright, so on the left is estimated losses in all four scenarios, the bottom two blue bars being the "Baseline" and the top two being the "Adverse." Then on the right is losses realized/provisioned to date.


First, Wells Fargo.


Ugh. Almost enough to cover the range of "Baseline" losses, but we should keep in mind, the baseline assumed unemployment would average 8.8% in 2010. Its currently 9.8%. The adverse assumed 2010 unemployment of 10.3%. Given that unemployment is almost assured to go higher before it falls, I'd be shocked if the number weren't closer to 10.3% than 8.8%. Not that loan losses couldn't possibly outperform the unemployment rate if you will, but I'd consider the red area more likely than the blue area.


Moving on to Bank of America.


About the same, although the mix of loans makes the distribution of blue and red a little different. Regardless, a long way to go here.


Now J.P. Morgan.


A little better. Jamie Dimon has more than the Baseline SCAP loss estimate covered. Still, you'd think there are more losses coming here.


So comparing the three, I ran the losses already accounted as a percentage of the Baseline Low and Adverse High (in other words, the lowest and highest loss estimates in the SCAP) for each bank. Below is that chart.

Ugh again. At least with J.P. Morgan I can squint my eyes real hard and suppose that they might be getting close, especially given J.P.'s relatively small commercial loan book. But looking at Wells Fargo and Bank of America, these are still banks that are going to struggle to keep up with losses as far as I can see.


Now consider this. Bank of America 2014 bonds are +210, Wells Fargo +150, J.P. Morgan +140. Shouldn't Wells and BofA be a lot closer? Shouldn't there be a bigger gap between Wells and JPM?

Tuesday, October 20, 2009

Clumsy and Random Thoughts 10/20/09

  • In Friday's post on my 10-year trades, I got some great feedback. Keep it coming. I neglected to mention what my price goal and where my stop would be. I think if we push through 3.48%, the next significant support point is 3.71%. So that's my price target. I'll of course be watching the patterns developing in the interim.
  • As for a stop out, I'm dangerously close already at 3.37%. I'm comfortable with the fact that I may take several small losses before I finally hit my big gain. I think that's part of trading.
  • One commenter specifically suggested that I should have waited for an actual breech of 3.48% before taking on a short. That's an extremely fair criticism. That would be the classic way to play the trade I described. I was being a little more aggressive due to my view that negative momentum had already been established. If I get stopped out, clearly it will look like I was a bit too aggressive.
  • If I am stopped out, I'll be looking to reset the short, not set a long. I don't like to trade against my fundamental view, which currently is bearish. So I'll most likely either be short or nothing in the near-term. Next week's new auctions could provide an opening for another short.
  • Last week I also suggested munis would likely stabilize. Indeed last week's backup is now looking like a correction rather than the start of something more serious. I've been hearing that the supply over-hang on syndicate desks has been reduced considerably.
  • However, something to watch. According to AMG, muni fund flows fell to $615 million last week, vs. a $1.8 billion the previous week. Weekly flows had been running in the $1.5 billion range pretty consistently for the last couple months.

Friday, October 16, 2009

Don't get technical with me! 10/16/09

I've decided to start a new regular segment on Accrued Interest doing technical analysis of the 10-year Treasury. I'm planning on doing this about weekly, although I won't swear it will always be on the same day.

This will be something of a departure for this blog, since classically I've rarely talked about trades I'm actually doing and even more rarely talked about short term trades I'm actually doing. But here is why I'm doing it. I think that going forward, there will be more money to be made trading bonds with a short-term view. I believe volatility will be permanently higher than in the recent past, and the ability to discern short-term movements will be the key to making money. I'd like to think opening up a discussion will help readers make more profitable trades.

The other reason is purely selfish. It is my long-term goal to start my own hedge fund. It wouldn't really be for the money, more because I think that's how I'm wired. If I could be running my own hedge fund but my income was only 75% of what it is now, I'd make that trade in a second. Anyway, although this eventual move may be a few years away, I've already built many of the models I plan to use as part of my trading strategy. Treasury technicals isn't a model per se but it would be part of my trading strategy. The models are proprietary, but technicals aren't. And besides, by sharing my strategies, I hope to get feedback from readers to perhaps improve my results.

So let's get to it. You may remember last week I showed a chart suggesting that yields on 10s ought to fall. Didn't happen, so let's review what actually did. Below is a similar chart to the one from last week updated to now.


Note this is a yield chart, so downward moves are bullish. The yellow line is a 200D SMA, the red and green were trend lines I drew. At the time, the red and green seemed to suggest to me a pattern of lower lows and higher highs. But now it looks like a wedge. It bounced off the SMA, broke above the trend line and would seem to be headed higher in yield, lower in price.

The above is a 30D intra-day price chart for the current 10-year. You can see the gap downward on 10/9, 10/12 was a holiday, 10/13 we filled most of the gap, and then started moving lower again.

Looking at a plan vanilla MACD chart, short-term momentum is clearly bearish.


So the trade looks like a short. What's the entry? Seems like there is resistance at 3.48%. This bar chart (with Fibs) shows there has been a lot of work done right around the current price level (this is a price chart, I know, price/yield gets confusing. You'll get used to it.) I've circled the price area of approximately 101-3 to 101-16, where we see lots of action in early-mid September. That corresponds to about a 3.45-3.48% yield. Right where we are now.


Note that bond guys didn't seem to give a shit about the 50% re-trace from the highs. I know a lot of bond guys follow Fibonacci re-traces, but I honestly haven't been able to make it work for me all too often. Don't be fooled by the fact that 3.48% is very near the 38.2% line, because when all those trades were happening, it wasn't the 38.2% line! Only once we hit the high on 10/2 did that become the number.

3.48% is backed up by this intra-day yield chart. The yellow line is 3.48%.


After doing all this, my play is to leg into a short in three parts. First I've put on some right now. Second I may get the chance to put on more at about 101-24, or 3.41%,. Again, looking at the intra-day, that looks like an area of high-volume that we could revisit on a bounce off the 3.48% resistance. Then I'd add a third chunk once we breach that resistance in a meaningful way, maybe 3.50%.

Thursday, October 15, 2009

J.P. Morgan vs. Citigroup: Boy, it's lucky you had these compartments

Here is my take on bank earnings reports. I'm coming at this from a bond guy's perspective, so I'm a little less worried about whether certain revenues are recurring or not. By this I mean, JP's fixed income trading revenues were probably higher than what we can realistically expect in the future. That being said, JP will probably have robust trading revenues in future quarters, just maybe not this robust. Same with the elevated NIM. Remember, bond guys don't care whether EPS is $1.5 or $1.55/share. We care about ticking time bombs.

So I'm more interested in whether banks are working through their problems. We know it will be a while before loan losses start falling, but at some point, banks will have actually provisioned enough. I don't think we're there now, nor do I think we'll be there in the next couple quarters. So what I want to see banks doing is using this period of elevated NIM/trading gains to build reserves against future.

What I don't want to see is banks using the recent slowing in consumer delinquency growth (note I said slower growth) to project lower loan losses in the future, and thus manipulate earnings higher. That's just not an honest assessment of the situation, as far as I'm concerned. Yes, maybe delinquencies are slowing, but losses are still growing. There is no way around that.

Witness the difference between J.P. Morgan's report yesterday and Citigroup's today.

Here is JP's summary of their consumer loan portfolio. First home lending: (circles were in the original).

Home equity portfolio looks improved, but weakness everywhere else. Then there is credit cards. Same story.


Alright, so not some kind of disaster, but clearly loan losses continue.

Now here is Citi's home lending portion of their presentation.

Same story right? 2nd Mortgages would include Home Equity, so maybe some improvement there, but on first mortgages, problems continue, actually seem to be accelerating.

On commercial, Citi didn't break out commercial loan performance in their presentation, and J.P.'s doesn't show much change. Probably just reflects the fact that commercial losses are coming whereas residential losses are here.

So what did both companies do with this information? J.P. increased consumer loan loss reserves by $2 billion to 4.6% despite the fact that overall charge-offs declined. Citi only increases loan loss reserves by $800 million to 6.4% of all loans. The ratio of loss allowance to charge-offs is 1.2x for J.P. Morgan, its 1.1x for Citigroup.

This all bothers me. It seems to me that the trends are weaker for Citi but they are taking less in loan loss provisions when compared to their charge-offs.

Maybe I'm making too much of this. But I can tell you this. I own JPM bonds. I don't own Citi.

Citi vs. JP Morgan: I don't know what you're talking about

Probably don't.

I'm going to go through a more in-depth study of this, but at first glance, I don't like Citi's report at all. I don't mind gains driven by mark-ups. Some level of mark-up is legitimate this quarter. But a decrease in loan loss provision? A day after J.P. Morgan increased their provision? This reeks of earnings management.

I'll post more thoughts as I get through the report, but I welcome your comments.

Wednesday, October 14, 2009

Municipal Bonds: As clumsy as it is stupid

Municipal bonds are getting crushed again today. 10-year MMD was cut 13bps today after being cut 11bps yesterday. That's something like -2 points in price losses in two days. Closed-end funds are getting absolutely crushed. Traders I've talked to are blaming street selling. Here's what's been happening.

For weeks, the bid for munis seemed endless. Even as the ratio with Treasury bonds hit historic low levels, (75% on 10's) mutual fund flows were so strong and new issuance was so light that dealers couldn't keep bonds in stock. So they bid every competitive deal like a Correlian smuggler hitting on an Alderaanian princess.

Then all of a sudden the street found the level at which people just wouldn't buy. I'm not sure if fund flows have tapered off or if its just a buyers strike, but my bet is on the former. Now dealers are stuck with bonds in syndicate. If you are a dealer like Stone & Youngberg or R.W. Baird or Loop Capital (i.e., the regionals who are mainstays of the muni market) getting stuck with $20 million bonds really does matter to you. That's real capital that isn't making you any money. In fact, if you have to cheapen up your offering, it costs you money. You're taking losses on those bonds.

In other muni news, today we got two interesting BAB deals. The Crimson Tide vs. the Minutemen. Wouldn't be much of a match on the football field, and wasn't much of a match in the muni market either. University of Alabama brought a 2039 maturity (among others) with initial talk in the +220 area (that's 2.2% above 30-year Treasuries in yield). UMASS was talking +225 for the same maturity. 'Bama is rated Aa3/AA- while UMASS is rated Aa3/A+. Not really any difference.

Citigroup struggled to sell UMASS, even cheapening it up by 10bps. As I'm writing this, I don't believe the deal is done yet, after two days of selling it. Meanwhile Morgan Keegan had a food fight on their hands. Investors clamored for 'Bama, causing Keegan to tighten the bonds by 15bps. Many times over-subscribed.

So in the final analysis UMASS had to pay at least 30bps more in yield to sell their bond compared to University of Alabama. Why? Because no one trusts Massachusetts' budget. Note to politicians around the country. Your actions have consequences. That's real money UMASS is going to pay to bond holders instead of using it for education.

Finally, I heard today that the Nuveen Insured Dividend Advantage Fund (closed end) is selling $100 million of $10 par preferreds. This is intended to replace some of their existing auction-rate preferred bonds which have been stuck in limbo for nearly two years. Worth noting that its structured as fixed rate at 3% for 5-years (tax-exempt) with a premium call after 1-year. That's a hell of a rate! To my knowledge, CEF's never have sold fixed-rate preferred stock to fund their leverage in the past. It creates some risk that investment rates will fall below their leverage cost, but then again, they can call the damn things if they have to. If rates rise this thing would be a boon for the Nuveen fund. Look for all the closed-end funds to follow suit.

I think munis will come back, at least vs. Treasuries. We're now at a somewhat cheap 90% ratio on 10yr munis. I don't think anything has fundamentally changed and I don't think this sell-off has anything to do with credit fears. Problem is that it might be Treasury rates rising that gets the ratio back to 85% or so. Either way, I'm not going to jump in front of the train!

Disclosure: Bought the 'Bama bonds

Monday, October 12, 2009

Debt Monetization: He's heading for that small moon

I received numerous e-mails and comments in response to Friday’s piece, many of which were very reasonable critiques, all of which I appreciated. One basic question which was asked multiple times was why I make a distinction between what the Fed is currently doing (quantitative easing) and debt monetization. I’m going to try to answer this question below. As always, please feel free to comment and/or write me an e-mail if you have further questions. I welcome the debate. If however you start an e-mail with, “You idiot!” I am somewhat less likely to respond.

First, let’s frame the discussion. If one defines debt monetization as simply the creation of money for purpose of buying government debt, then there isn’t a distinction between the Fed’s quantitative easing program and debt monetization. In fact, by that simple definition, there is no difference between the Fed’s normal open market operations, which often involve doing repos with Treasury collateral, and debt monetization. But as a trader, I don’t give a dewback's tail what you call it. I care what the effect is. Clearly there is some distinction to be drawn between old-school open market operations, today’s quantitative easing program, and full scale debt monetization, at least in terms of degrees. So let’s agree that there is no utility in turning this into a discussion of semantics.

Is this a case of the argument of the beard? That is to say there is no difference between $1 of debt monetization and $1 trillion because you can’t pin down exactly where it stops being open market operations and when it becomes something else? No. We can draw a distinction, even if its somewhat subjective. And from this distinction we can create more objective signposts for when there is an evolution of the policy.

Consider what the definition of quantitative easing is. Its simply the process of printing a small moon-sized amount of new money (or creating bank reserves as its done in practice) and unleashing it on the economy. It is not necessarily the process of buying government debt with the proceeds of created bank reserves. The purchasing of government debt is merely a convenient, and potentially highly effective, means of getting that new money out into the economy.

The intent of quantitative easing is to create inflation. I know, shocking thought, right? But the reality is that sometimes the market-clearing rate of interest is actually below zero. That is that demand for savings is so great that it overwhelms demand for credit. This is the so-called liquidity trap. Real interest rates need to be negative, but nominal interest rates can never be negative. The Fed can only cut to zero. Thus we need more inflation. That would allow nominal rates to fall below the inflation rate, resulting in a negative real rate. Here is a good piece by Paul Krugman on the subject. It was written in 1998 to describe the problems in Japan, but its relevant for the U.S. today. I’ll pull out one section to save you the trouble:

"If this… [liquidity trap]… bears any resemblance to the real problem facing Japan, the policy implications are radical. Structural reforms that raise the long-run growth rate (or relax non-price credit constraints) might alleviate the problem; so might deficit-financed government spending. But the simplest way out of the slump is to give the economy the inflationary expectations it needs. This means that the central bank must make a credible commitment to engage in what would in other contexts be regarded as irresponsible monetary policy - that is, convince the private sector that it will not reverse its current monetary expansion when prices begin to rise!"

Ben Bernanke himself referenced this strategy back in 2002, before he was Fed chair. (By the way, a time when the deficit wasn't nearly the problem it is now). Currency, he explains, only has value because of its scarcity. If you need inflation (i.e., you need the currency’s value to decline), just make more money! "The U.S. government has a technology, called a printing press (or, today, its electronic equivalent), that allows it to produce as many U.S. dollars as it wishes at essentially no cost."

So we can debate whether or not the U.S. is in such a dire predicament as to necessitate this radical monetary maneuver, but its clear to me that the Fed’s current programs are designed around the above thinking. We’re trying to fight deflation to prevent a Japanese-style disaster.

Debt monetization, on the other hand, has the intention of extinguishing government debt through creation of new money. That is, the government is alleviated from its debt burden by way of the printing press. Has this, in fact, occurred? Any honest person, no matter what your opinion on the situation, can only answer maybe. As I stand here now, this 12th day of October in the Year of our Lord Two Thousand and Nine, I don’t know what the Fed will eventually do with the Treasuries it has purchased. If they are held to maturity, I’d have to admit that the Fed did indeed participate in debt monetization. Maybe it was on a limited scale, but it was monetization none-the-less. I also don’t draw any distinction between Agency debt (Fannie Mae/Freddie Mac/Federal Home Loan Bank) and Treasury debt. Both are de facto debt of the tax-payers. I’ll make some distinction in regards to Agency MBS which isn't debt of the government, rather a guarantee by the government.

Whether you agree with me or not, there is my view on the current situation. What’s more interesting is what it all means for the markets. One commenter accused me of drawing a distinction without a difference. Very fair. I basically just said that I don’t know whether the Fed is going to monetize the debt or not. Does it actually matter which it is?

Let’s say, for the sake of argument, that the Fed ends its bond buying program by March 2010 without increasing the amount purchased, as they currently have pledged. I know the hard-core monetization believers believe they will need to keep the printing presses going in order to nominally service our debt. That’s not my view, and I don’t know if anything other than time will convince that group otherwise anyway. So I’m going to let that go for now.

I’m saying if they finish buying all they said they’d buy and do no more, they could either figure out some means of unloading their positions over time, or else hold to maturity, effectively monetizing that portion of the debt. Does it matter?

One way to think about this is just to consider the impact of printing money, regardless of what is done with the proceeds. Classically, we’d expect the impact to all be related to inflation: higher interest rates, weaker dollar, higher commodities prices, higher inflation.

The Fed announced its program to purchase Agency and Agency MBS on November 25, 2008. Here is where we were the day before the announcement.

  • 10-year Treasury: 3.32%. We’re marginally higher now at 3.38%.
  • 2-year Treasury: 1.21%. We’re marginally lower now at 0.97%.
  • Dollar: The DXY was 86.081 on 11/24. Now 76.139. 11.55% lower.
  • Commodities: The CRB was 243.80 on 11/24. Now 266.26, or 9.21% higher.
  • CPI: The All Items Index stood at 216.889 in October 2008. Now its 0.67% lower at 215.428.

Mixed record. Really Treasury rates are basically unchanged and consumer prices are marginally lower. Not what you’d expect. Commodities and the dollar are reacting exactly as you’d expect.

Interesting to note that the Treasury program was announced on March 18. The Agency program was expanded on that same date. Same info from March 17:

  • 10-year Treasury: 3.01% on 3/17, now 3.38%.
  • 2-year Treasury: 1.03%, now 0.97%.
  • Dollar: 86.933 vs. 76.139. Shows just about all the dollar decline came after the announcement of the expansion.
  • Commodities: The CRB was 216.46, now 266.26. Here again, all the gain has been post expansion of quantitative easing.

So if the Fed’s goal was to weaken the dollar in order to create inflation, it looks like its working. Maybe it isn't showing up in the CPI numbers much yet, but it certainly is showing up in actively traded markets where the purchasing power of a dollar is most relevant. Furthermore, the market may be telling us that the first foray into QE wasn't enough. Only with our combined strength can we bring an end to this destructive deflation!

And that’s just the question, isn't it? No one would claim that printing money was a good idea if deflation weren't such a legitimate threat. To me, the fact that the Fed decided to buy Treasuries isn't the important point. Just the act of printing $1.5 trillion dollars to finance all these purchases is the key. They claim that part of their goal was to lower interest rates and thus encourage borrowing. Maybe that was part of the motivation. But I truly believe the Fed saw consumer and business borrowing collapsing at a disastrous pace and choose to answer with a deflation busting level of quantitative easing. Dropping the newly printed money from a helicopter isn't practical. Buying Treasury bonds is.

I’m asking you, dear reader, that if you object to what the Fed is doing, ask yourself why? Is it because you object to printing money? Or buying of government debt? Because if it’s the later and not the former, then ask yourself what else was the Fed supposed to do with the money? If it’s the former and not the later, then you must argue that deflation isn't a threat. That the complete collapse of credit creation has no impact on the de facto money supply. That’s a legitimate point of view, but not one where I can concur.

So then it comes to a matter of the exit strategy. If the Fed holds on to the debt, then the impact of the recently created new cash will reverberate beyond the current crisis and into a time when economic activity has normalized. That’s the dark path the Fed must not go down. Fed officials have recently said that an accommodative policy is warranted for an extended period. But policy needn't be this accommodative for an extended period! We've heard that the Fed is testing reverse repos as a means of removing excess reserves when the time comes. Here’s to hoping that they start removing those excess reserves is a measured way sooner rather than later.

That being said, what if the Fed uses reverse repos to remove all monetary impact of their quantitative easing project and yet never actually sells any securities. They just let everything roll off. By my original definition, that’s debt monetization. But would it matter? Would the impact on inflation, the dollar, commodities, etc., be radically different than if they slowly sold off their Treasury and Agency portfolios? Probably not.

So then it comes back to intention. Why did the Fed decide to embark on this QE journey? Is it the Fed’s intention to help the Treasury service its debt? Or is it to battle the economic circumstances in which we've put ourselves? I can’t answer that question definitively. I think it’s the later, but I’m not in on the FOMC meetings. I don’t really know.

Bringing all of this back to Echo Base, here are my conclusions. If you focus too much on the Treasury/Agency purchases, you are missing the key likely market impact. The new money creation is the primary thing here. What is done with the money is secondary. A weaker dollar, higher gold/oil/agricultural prices are not symptoms of a run-away Fed, but symptoms of an economy that was threatening deflation and now is more normalized. Finally, we need to watch how committed the Fed is to an exit. Are they willing to risk a double dip recession? Because that might be what it takes to remove the massive monetary stimulus that’s been created thus far. So far they've talked a good game. Let’s see what they actually do.

Friday, October 09, 2009

Ben Bernanke... only you could be so bold

I'm going to give you series of number pairs. Don't worry about what they are, I don't want you to bring any biases into this. Just consider the pattern.

  • 2, 4
  • 4, 6.5
  • 1, 2
  • 4, 6.5
  • 6.5, 30
  • 1, 2
  • 6.5, 30
  • 2, 4
  • 4, 6.5
  • 6.5, 30
  • 4, 6.5
  • 1, 2
  • 6.5, 30
  • 2, 4
  • 4, 6.5
  • 1, 2
  • 6.5, 30
  • 4, 6.5

Is there an exact pattern? If so, I don't see it. But we do see three obvious facts. First there is a discrete set of possible number pairs. Second, each of the pairs seem to show up with fair regularity. Third, the pairs never repeat twice in a row.

So if you had to guess, which pair would you expect next? 2, 4 right? Just because its the pair that hasn't appeared for the longest.

Alright, new topic.

Fannie Mae issues "benchmark" bonds each month, or at least they plan to do so. These are large, non-callable issues of at least $3 billion. At one time, that might have included anything from 2, 3, 5, 10 or 30-year maturities, although I don't believe they've done anything longer than 5-years in a while. Regardless, we knew Fannie would be announcing a benchmark issue on October 7th for several months. Here is a release dating to March which shows 10/7 as a benchmark issue date. For what its worth, it took me 13 seconds to find proof that Fannie was planning to issue on 10/7 for months.

Now let's bring this home. The "pattern" above is the maturity ranges the Fed has been buying as part of its Agency buy-back program since June. Remember these buybacks are every Thursday. Have been for months. Everyone knows what day the buyback happens, we just don't know exactly what the maturity range will be. But if you look at the pattern above, anyone with a 3rd grade education could guess that 2-4 was a very strong candidate. And by the way, the Fed basically offers to buy back any benchmark bond within that maturity band. So it would have been unusual for the Fed not to include the newly issued Fannie 2-year benchmark.

If the Fed is going to buy agency bonds every Thursday, then it was destined for months that the Fed would be doing a buyback the day after Fannie did their benchmark issuance. In fact, as long as Fannie is going to issue benchmark bonds once a month and the Fed is going to do buybacks once a week, it was inevitable that one of the buybacks would happen right around a new issuance. This isn't a conspiracy, its simple math.

So at best, you can argue that Fannie choose to do a 2-year issue hoping that would be what the Fed was going to buy back. Or I suppose you could argue that the Fed told Fannie Mae which set of securities they were buying back. Gave them a heads up. Still you have to wonder of what great advantage such a heads up would be. Looking back at the pattern, if the Fed didn't buy 2-year agency bonds this week, certainly it would be next week. Wall Street would know that.

So let's remember the three inescapable conclusions here. As long as the Fed is going to be buying Agency debentures in already established pattern, and as long as Fannie Mae is going to be doing monthly issuance of benchmark securities, it was bound to happen that issuance and buyback would occur in very close proximity. Wall Street has been aware of both the timing of the buyback and the timing of Fannie's new issue for months.

So why do I bring this up? Because of this post at Zero Hedge. Basically saying that the Fed's decision to buy the newly issued Fannie bond was "blatant" monetization. The author claims to be "dumbfounded" that the fed would be so bold. The Imperial Senate will not sit still for this!

I don't have a problem with claims that the Fed is conducting de facto monetization through its QE efforts. I don't agree. I think Quantitative Easing is a legitimate monetary policy tool. But I readily admit that the distance between QE and monetization is no more than three meters wide. I think the Fed is still on the correct side of that line, but it is a perfectly legitimate and important public policy debate. I'm open minded to the possibility that the Fed could cross that line at some point. I welcome rational and objective discussion aimed at convincing me and others that the line has already been crossed.

To be fair, I don't read Zero Hedge, so I am loathe to generalize about the opinions held on that site. However its obvious that the author is of the opinion that the Fed has crossed the line. Fine. Let's hear the case. But instead, Zero Hedge tries to link this particular buy back with debt monetization, when I've clearly shown above that this particular buy back doesn't indicate anything either way. Zero Hedge is presenting non-evidence as evidence.

So one of two things must be going on. Either Zero Hedge is ignorant of all the above facts, or he's intentionally ignoring the facts to make his argument more sensationalist.

And that's is what is so incredibly frustrating. We can't have rational debate in America any more. No one wants to coldly and objectively discuss facts. Reasonable minds can differ. I've looked at the factual evidence, used my economic training and my bond trading experience and concluded that what the Fed is doing doesn't amount to monetization. Someone else could look at the same evidence and come to a different conclusion. Wouldn't it be nice if the blogosphere was full of people explaining their point of view using objective facts in the spirit of reasoned debate?

But that doesn't happen, because that doesn't generate hits. To generate hits you need to be sensationalist. Everything has to be a conspiracy or a pending disaster. And no one gives a gundar's ear about credibility. So why should a blogger bother checking facts? Why bother asking a bond trader about how these agency buy backs work, just to make sure your first read of the situation is correct? No. Better to just run with the piece assuming conspiracy because your readers will assume credibility. As of this writing, Zero Hedge's post on the agency buyback has generated over 2,000 hits. A quick Google search reveals at least 13 websites linking to the Zero Hedge piece. At a glance all are supportive of Zero Hedge's position. No one questions anything.

And that's a summary of just about every debate here in America. Both sides feel the need to sensationalize their argument, facts be damned. So the debate devolves into an argument about facts rather than a debate on the merits of an argument. The left says x millions of Americans don't have health insurance. The right says no! Its more like a much smaller y millions. And around and around we go throwing out massaged number after massaged number, never actually getting to discuss the real issue of whether government should be providing health care.

Let me be very clear. Even if you the Fed was trying to monetize the Federal debt, this particular agency buy back shouldn't strengthen that view. The Fed is conducting its agency buy back program the same way it always has. Fannie Mae is conducting its debt issuance the same way it always has. No matter what your view, this is a non-event. Don't write me a bunch of e-mails saying that I don't get it. I understand the monetization argument. I really do. This particular fact has nothing to do with anything.

By presenting this non-evidence as evidence, Zero Hedge is only succeeding in being inflammatory. He's riling up people who already feel a certain way. That kind of thing makes any hope of a rational debate fade. There are those that hail the internet as this sort of modern day salon. Where any voice can be heard, creating a Renaissance of intelligent thought. Sadly I think its just the opposite.

Wednesday, October 07, 2009

Treasury yields: He steps off the gantry platform

I know most readers don't want to hear this... but look objectively at this chart.

Aren't yields going lower? We're sitting on the 200 day MA, we're well through any other moving average. Any way you slice it, we've got lower lows and lower highs. Demand for today's 10-year auction was very robust. The bid/cover was 3.01x, the second highest in the last 15 years. Foreign demand for Treasuries is as strong as ever.

To top it off, every one hates rates here. Of economists surveyed by Bloomberg, only 3 out of 54 respondents expect rates to be lower at this time next year. Now I'm not sure I think rates will be this low 12 months from now, but it seems like rates will keep rallying from here. I'm targeting 3.05-3.00% on 10s.

Tuesday, October 06, 2009

Delinquencies: We can pay you 2,000 now...

Last week I wrote about my disdain for the Payrolls statistic. Basically I argued that its always been a lagging indicator so why does it result in such a large market reaction? There were some interesting comments that I want to follow-up on. One commenter suggested that "every job lost is another mortgage in jeopardy..." I responded that the data doesn't support this, that delinquencies are leveling out. Another commenter (maybe the same one, it was anonymous) said, "Delinquencies are slowing? I don't see it." then posted this chart: (source = St. Louis Fed: http://research.stlouisfed.org/fred2/series/NPTLTL?cid=93)


Obviously the chart above is what it is, and certainly doesn't show any leveling off. However, it isn't consumer specific, and the commenter's argument was about consumer loans. I thought I'd share how I track consumer loans. I use a sampling of securitized mortgages and credit cards. This isn't perfect. First I'm taking a sampling which always has risks. Second, there is probably a bias to loans that have been securitized. Most likely securitized loans are somewhat worse than loans held on balance sheet by the same bank. It is also likely that there is some bias by what types of loans fit into securitized pools, what kinds of structures investors demanded, etc.

However, the advantage is that the data is available much quicker than other sources. So the above chart from the St. Louis Fed is only updated to 2Q, I have data up to August, and in two weeks I'll have September. Plus I can limit my sampling to certain vintages. In particular I look most closely at 2006 and 2007 vintages for mortgages.

Anyway, here is my data. First sub-prime home equity (comparable to the ABX).

Photobucket

I've got four lines. The 30, 60, and 90 are unique sets, where as 90+ includes everything from 3-months late to foreclosed. So I think that's the most interesting set. There is obviously a leveling out here. Obviously if we took the time series back a year or two, you'd see a huge ramp up. Note that the 90 day bucket keeps rising (despite falling 30's and 60's) and that tells you that once a mortgage goes delinquent, it just keeps moving through to foreclosure.

Then non-conforming prime mortgages. Remember these are mostly stuff like Option ARMs, low docs, and/or other creative financings. Again, its my own sampling of RMBS deals from 2006 and 2007, so it won't necessarily match up with any other statistics out there.

Photobucket

That's still rising, but again, at a much slower pace compared with last year. I think both of these are consistent with a burning out of the bad lending that was going on in 2006-2007.

Finally I have credit cards. These are a little different than mortgage securitizations because the lending period tends to be so short. So here I've ignored vintage and just gone with the master trust data. Note also that this shows 30+ whereas the other charts had 30 day delinquencies as a unique bucket.

Photobucket

Here is my point. All is not right with the world. Banks are still struggling with bad consumer loans. Commercial loan problems are just now beginning. However to suggest that unemployment is a key driver of recent delinquencies just doesn't fit the data. Delinquencies are leveling out just as unemployment is ramping up. Of course, when people lose their jobs it certain has a negative effect on their ability to service debt. So I think the correct way to think about this is that we really have two waves of consumer loan losses. The first is related to bad lending. These are burning out now and won't be a problem on the margins going forward.

The second is old-fashioned recession style delinquencies. The reasonably structured loan that goes bad because someone lost their job. Obviously those will be increasing with unemployment. But I suspect that losses related to bad lending will dwarf those from this second wave of delinquencies related to unemployment.

In terms of a macro-economic view, I think the consequences of all this are more negative for banks than for consumer spending. Although I'm not terribly bullish on consumer spending, I do think consumers keep consuming at some reasonable pace. The people with jobs will keep spending, and the people who lose their jobs will resume spending once they find work. However even if consumer lending losses are leveling off here, they are still very high, and commercial lending problems are just now coming to fore.

Monday, October 05, 2009

TIPS Auction: What is it?

Here is an interesting question. If the TIPs auction about to go off does well, will coupon Treasuries rally? Will demand for TIPs reflect good demand for bonds in general, or fear of inflation? If its the former, then Treasuries should rally. If its the later, then Treasuries will sell-off.

Either way, I've got a small bet on the long end rallying right now. I don't have a ton of conviction about it.

Do not underestimate the power of the back bid

I've switched from positive to negative on credit spreads on Wednesday of last week. Since then we had a big sell-off in spreads on Thursday on the Jobless claims number. Friday we started out with a mini panic in credit spreads after the payrolls number, and I was feeling pretty good about my call. But the afternoon saw credit spreads rally hard to where most names were flat to slightly tighter. Today we're rallying hard. Bank/finance is 10-15 tighter across the board.

I'm sticking by my models and remaining short credit. But its worthwhile to note that there is a massive back bid in the corporate bond market. Its flowing from a number of sources. The most obvious is that fact that mutual fund flows are dominated by bond flows. A typical core taxable bond fund is going to be 50-80% corporate bonds (vs. about 20% of the overall investment-grade universe) and thus every dollar that comes into bond funds tends to hit the corporate bond market disproportionately.

Another key point is the general disdain for Treasury yields from traditional money managers. I can't tell you how many bond salesmen tell me that their accounts have excess cash to put to work. Almost universally small to mid-sized advisors have been negative on interest rates since the 10-year first fell below 4%.

You can imagine the mindset. The 10-year rate started rising in rapidly March from 2.5% eventually all the way to 4%. Since you were negative on interest rates, you probably were holding a lot of cash. You are feeling pretty good about yourself. Then you rally to 3.80%. You keep accumulating cash, figuring it will come back to 4% again. Then it rallies to 3.60%, and hell, if you didn't like it at 3.80% you can't like it at 3.60%. Then its 3.40%... then 3.20%... and now the pressure is on. You've been holding a ton of cash, earning you nothing and producing no capital appreciation, while the rest of the market (and your benchmark index) is leaving you in the dust. You've reached a point of pain where you can no longer wait out the interest rate cycle. You have to get your cash to work.

But now cognitive dissonance comes into play. You had assumed you were a genius back when rates were skyrocketing. When 10's were at 3.80%, your logic had been that "rates are just too low" and now they are even lower. How can your brain marry your self image as a smart investor with the fact that now you need to buy bonds at extremely low rates?

The answer is you fool yourself into believing that if you buy something other than Treasuries, you will be safe. So you buy 10-year Pepsi bonds at +90. Spreads will keep tightening, you tell yourself. Pepsi is a great company, you tell yourself. +90 is a good spread for a company that used to trade with a +50 spread. Nevermind the simple math of it all. If you buy Pepsi bonds at +90 when the 10-year is 3.20%, that's an all-in yield of 4.10%.

The only way you can really justify this trade while maintaining the same interest rate view is if you would have bought the Pepsi bonds at a 4.10% yield when 10's were at 4%. Or a spread of +10. Which obviously you wouldn't have done, most obviously because you didn't do it!

The other thought you see a lot from people who miss big rallies is that they wait for any pull back to add. Again, its a cognitive dissonance thing. You can tell yourself you were smart to buy when you did because you correctly waited for a pull back. When in fact, you waited too long to buy period.

The truth is, a lot money managers are suffering from an abundance of cash and are scrambling to buy bonds. As long as that is the case, there will be a significant back bid for corporates.

Friday, October 02, 2009

Jobs: You... want... this...

I was all set to write a post today about how little I thought the jobs number mattered. How it is one of the most over-rated releases (maybe second to consumer confidence). Then the stock futures sell off 100 points and I smile, because its making my argument all that easier. Now we've traded back to flat. Blast! Whatever. I'll make my point anyway.

I've written several times that any number which doesn't predict anything isn't worth much to traders. Job growth is a notorious lagging indicator, so why should I put any stock in the Non-Farm Payroll number? Especially since there is a lot of seasonal adjustments and other extrapolations in these numbers. I refuse to read much into any given monthly number.

The exception is when it comes to Fed policy. If the number had come in very strong, say flat job growth, then I would have assumed a Fed hike was coming much sooner, maybe even January. The Fed has historically not been willing to hike rates while unemployment is rising. So if employment surprised big to the upside, that would leave the Fed much more willing to move. As it is, the number is steeply negative, and thus leaves unemployment flat to worsening. Not good, but not fundamentally different that where we were before the number.

In my mind, the economy remains a mixed bag. We will be getting some positive GDP growth for the next couple quarters as we rebound from the sharp decline of Q4 and Q1. After than bounce, we probably grow very slowly or possibly slip into a mild decline. The data supports this view. Just consider the non-job related numbers of the last two days: Personal income rising very slightly, Personal spending showing some signs of life with a 1.3% increase. Yet the ISM comes in at a tepid 52.6, which follows up on weak regional PMI numbers. Pending home sales looks solid at +6.4%. I still think Case Shiller is telling us home prices are bottoming. That's good.

So like I said, we may grow at a very tepid pace or we may slip back into mild negative growth. I think the difference will depend on how consumers react to the withdraw of government stimulus. My personal opinion is that the stimulus achieved less than what many perceive. Somewhat paradoxically, that's a relatively bullish thought since if the stimulus programs didn't do much, then the current uptick in consumer spending is sustainable on its own.

I think home sales, consumer spending, and manufacturing data are the statistics to watch most closely. Forget about job growth.