Wednesday, December 30, 2009

2010 Forecast: How's the gas mine? Is it paying off for you?

Well, its forecast time. I'm going to do this over the course of four posts, I think. Maybe more. This first post is going to focus on what I see for general economic growth in 2010 assuming basic conditions that exist today persist into the new year. The next post will discuss what I expect the Fed to do in response and why that might cause some problems for risk assets. The third post will look at what happens if the Fed doesn't do what they are supposed to do (a real risk to be sure) and what the consequences will be of that. The fourth post will answer whatever questions I get on the first three.


First I'd like to say that the economy is recovering, but not in quite the same way we've seen in the past. I know its become cliche to talk about a moderate recovery, so here is some nuance you aren't reading every where.


First, the industrial sector is enjoying a strong recovery. The ISM manufacturing survey and Fed's industrial production figures show above-average activity.


Other series confirm the same ideas. Durable goods orders are strong. Capacity utilization has risen from 68.3% to 71.3% in just 5 months. After the 2001 recession, it took over 2 years for capacity utilization to recover 3 percentage points.


It isn't terribly hard to see why industrial production has recovered so much. Look at inventories.

Knowing that demand was as low as it was in 4Q '08 and 1Q '09, the severe drop off in inventories points to virtually no actual production. Thus production has recently increased in a big way mainly as catch-up. For 6-months every one was so scared they did nothing. All that while inventories dwindled. Now in order to sell anything producers need to produce.


This is, of course, one of the textbook reasons why there is typically a boom period after a recession. Inventory rebuilding. That part of the cycle is hardly over. I went back and looked at inventory levels from 1960 to today and divided it by the current dollar PCE index. Basically its an economy-wide inventory to sales ratio.


At first glance this looks like a persistent decline over time. This can be explained by everything you were taught in business school about improvements in inventory management over time.

But take a second look. Basically the ratio is oscillating in a range from 1960-1980. Then there is persistent decline until about 2001, when the ratio gets stuck in the 14-15% range until 2008. Below I've zoomed in to the recent period.


You worry about those fighters! I'll worry about the tower! If firms were to increase inventories from 12.8% of sales to 14.5% of sales, holding PCE constant, it would require a 13.4% increase in inventory levels. That could add considerably to GDP in 2010.


So that's what's booming. You can guess what's mediocre. Consumers. Here's personal income growth.


Somewhat below average. And certainly far below average if we took out recessionary periods. Then consumer spending.


Same story. Below average and a good bit below average for non-recessionary periods.

What does this point to? A business-lead recovery. Its not impossible. Business spending can and does occur in the absence of strong consumer demand. We know that businesses have spent very little on capital replenishment. Below is non-residential private investment courtesy of the BEA.


You can see that the drop off is much more severe this recession than in 2001 or 1991. In fact, fixed investment as a percentage of GDP (9.5%) is at its lowest point since the early 1960s (although about the same as the 1990-1991 recession.) Since 1960, the average capital spending level as percentage of GDP is 11%. In order to get capital spending up to 11%, businesses would have to increase capex by 16%! Again, this could add considerably to GDP without a serious ramp-up in consumer spending. In fact, I'm modeling that fixed investment adds something like 1.1% to GDP in 2010.

Bottom line: I think GDP grows above 4% on average in 1Q and 2Q 2010, then drops off a bit into the mid 3's for the second half.

Next, we'll look at why a second recession is highly likely (but its 2-3 years out) if the Fed does its job right. Then we'll look at what happens if the Fed doesn't do its job right. Hint: think bell bottoms and burnt sienna couches.

Tuesday, December 15, 2009

Debt Wars Episode II: Attack of the Traders

My post from last week on debt generated some conversation about leverage and the value of arbitrage-free prices. Basically I'm arguing that if leverage (a.k.a. trading debt) is exceedingly expensive, then arbitragers won't be able to perform their essential function.

I wanted to illustrate this in a bit more detail by giving a admittedly stylized example. As you are reading this, bear in mind that I'm merely explaining why some degree of leverage is needed to produce efficient markets. This shouldn't be taken as an endorsement of any particular level of leverage, simply as an argument that Wall Street leverage is basically good.

Let's pretend we live in a world where there is a discrete amount of "real" money that is investable in the short-run. That is to say that all long-term investors have fully allocated their investments and any change in their demand for investments only occurs in the long-run. We can imagine this sort of like a world of dollar cost averagers who put some set amount of money aside for investment at the end of each year. However during the course of the year, the level of investable capital is constant.

Now let's assume we're at equilibrium and the market is perfectly efficient. Suddenly a new bond issue comes to market. Who is going to buy it? Given that investors don't have any uninvested assets, the only way an investor could buy this new asset is if they sell other assets. This can't work, of course, because if one investor sells another investor has to buy. There isn't any available net capital in the system.

Now many readers are thinking to themselves that this is a dumb example, since obviously my initial assumption doesn't hold. We see capital flowing back and forth all the time. Investable assets obviously aren't fixed.

Or are they? Consider who makes up real money investors. Individuals? They might have some assets sitting in their checking account which could in theory be invested, but its clearly limited. They have bills to pay with their liquid money. Corporations? Similar to individuals. Mutual funds? On any given day, they only have what they have.

Maybe we can't say that investable assets are literally fixed, but I argue that in the short run its damn close.

Furthermore, real money isn't going to react to relatively small arbitrage opportunities. Let's assume the yield curve is dead flat at 5%. Let's further assume that ABC Corp has bonds outstanding due in 2018 currently trading with a 6% yield. Now ABC wants to sell new bonds which will have a maturity in 2019. What should the yield be? With a flat yield curve, the yield should be extremely close to the 2018 bonds.

But if real money has limited excess capital, there will be a supply/demand imbalance here. Real money will have to be enticed to bring in new capital, and therefore the absolute yield will have to be large enough to do the enticing. Relative yield doesn't apply.

Put yourself in this situation. You wake up one morning comfortable with your investments when some poor bond salesman calls you up and asks about these new ABC Corp bonds. You admit that you have some money in your checking account, but are you going to tie up your liquidity for a 6% yield? Or 6.5%? Or 7%? Depends on your own situation. Might have to be 9% or 10%.

Now let's introduce the possibility of fast money. They also have limited capital, but we'll assume they also have access to leverage.

So back to ABC Corp. They look to sell new bonds. Real money is strapped and wouldn't be enticed unless the yield is 8%. But fast money can afford to go long new bonds vs. a short of the 2018 bonds with a yield differential that is much smaller. If fast money can get 10/1 leverage, a 1% differential earns them a 10% IRR. Or even better, fast money can speculate that once ABC Corp has sold their large bond issue, the supply/demand picture will improve. That is to say, if ABC Corp wants to sell $1 billion in bonds, real money can't take it down. But once the deal clears, fast money can sell the $1 billion bonds in smaller chunks at a tighter spread. Maybe fast money would therefore take the bonds at 6.25% and try to sell them off at 6%. That would be about a 2% price gain. At 10/1 leverage, that's a 20% IRR.

Why do we care about ABC Corp's cost of funding? Because the markets are supposed to be an arbiter of capital. If the cost of capital is distorted by technicals, the market can't function in this manner.

This problem is most glaring when the market is in panic mode. Last fall, real money almost universally wanted to sell at the same time that fast money had no access to capital. Efficient markets completely broke down.

Again, it isn't that unlimited leverage is a good thing. But without leverage, markets can't work.

Thursday, December 10, 2009

Debt: How am I to know the good side from the bad?

I was listening to Megan McArdle on the EconTalk podcast the other day. (By the way, I recommend the EconTalk series for any real economics wonk. The subject matter is often not particularly investment related and it usually runs about an hour, but its my clear favorite podcast.) The subject of the podcast was Megan's Atlantic article titled "Lead us not into Debt" and the subject of consumer debt generally. At one point in the conversation the question is raised, is debt inherently bad?

The host, Russ Roberts, made the point that recently many in the media have suggested that consumers need access to debt in order to finance current spending, lest we suffer some sort of economic disaster. Its clear that the Fed agrees with this sentiment given how they've pushed the TALF for consumer asset-backed securities. Roberts questions whether this is really true, whether debt isn't, at least, more bad than good.

I'm a bond trader. Debt is my life. Granted, I'm more of a lender than a borrower professionally, but long-time readers will remember my defense of both the TALF and the bank bailouts as beneficial to main street primarily because I saw a functioning debt market as a necessary condition for a modern economy to function.

Roberts isn't the only one asking this question. Based on the comments and the e-mails I receive, I think many readers are sympathetic to this view. And its a great question, especially in light of the fact that our collective debts are what caused the financial crisis. Even further, the fact that our public debt is now growing at an alarming pace, potentially setting the grounds for another crisis. Isn't all this debt just bad?

After having mulled this over for three days, here is where I come out. First let's tackle debt for consumption. Specifically I'm thinking of any consumer product cheaper than a car. I'm also thinking in terms of pure positive economics, that is I'm not layering on my own judgement, merely what I think the laws of economics have to say.

First, I think there is a presumption among some that if consumer credit were tighter, there would be less aggregate demand. I don't think there is good economic evidence for this view. If a consumer buys some product, say a television, on credit, what's really happening? They are pulling forward demand. That same consumer later has to save to repay that debt. In the absence of credit, the consumer would have to save to buy the TV. I don't see what the difference is between saving to buy the TV in the first place vs. saving to repay the debt.

Let's put some numbers to this. Say its a $500 TV that the consumer puts on a credit card at 15%. Say that debt is repaid when the consumer gets a year-end bonus in exactly 6-months. Net of interest paid, the TV cost the consumer $537.50. If credit weren't available, the consumer simply waits until the year-end bonus hits and then buys the TV. As far as I can tell, aggregate demand is the same over time. In fact, since the consumer pays interest on the debt it would seem that the consumer's budget restraint results in lower demand over time the more debt is utilized.

I think some would argue that there is a multiplier effect, where more transactions are good economically. The spending turns into someone else's income which turns into someone else's spending which turns into someone else's income. Perhaps, but its still necessary for the debt to be serviced. I have to think any multiplier benefit is offset by the negative effect future savings (or more specifically debt re-payment) has on transactions.

Let's take this multiplier theory further. If we assume a transaction today has a certain multiplier impact, call it x. So the TV purchase wasn't just worth $500 to the economy but $500 times x. If that's true, then wouldn't it be that the $37.50 in interest spent would have a negative multiplier effect of $37.50/x? If the consumer just saved and bought the TV at a later date, then the $500x multiplier would hold, just at a later date, without the debt service drag.

On the flip side, there are clear examples where debt is good. I think where consumers borrow to fund asset purchases that's basically good debt. Obviously it can go too far, as we've seen recently. But its safe to say that without debt, there really couldn't be a housing market. People just wouldn't be able to lay out the kind of cash needed to purchase a home, and in most cases home's are a reasonable store of value.

I also think a lot of business debt is good. Businesses need debt to finance capital spending. Unlike the purchases of a television, corporations investing in new plant and equipment creates value for the economy. If their ability to create value is in excess of the interest cost of the debt, then I think the economy is better off.

Unlike consumer debt, business debt should tend to generate future cash flow rather, as opposed to simply pull forward demand for consumption. Thus there really is a multiplier effect to corporate leverage. Obviously too much leverage can be bad, but not enough leverage could be bad as well.

Now this next part isn't going to be popular but I'm going to say it anyway. Another area where we really need debt is on Wall Street. Here is the reality: without leverage, arbitrage-free prices won't hold. The market couldn't serve its function of properly allocating capital through the pricing mechanism. Don't believe me? What happens if two bonds deviate from their theoretical value. Maybe its two Ford Motor bonds with similar maturities trading at wildly different yields. If dealer firms have access to short-term financing, they step in an arbitrage the differential away. If they don't, then the mis-pricing remains. Again, obviously leverage can become too great, so I'm not arguing that unlimited debt is good, but I am arguing that at the core, trading debt is good.

This brings us to public debt. I'm tempted to say its always and everywhere bad because I'd really love to live in a world of zero public debt. But truth is if the Federal government basically operated like state and local governments, I would probably label public debt as good. For the most part, local governments have to have balanced budgets. Despite some tricks governments pull (especially New Jersey and California, but that's another post), that's generally true. Where local governments issue debt its for capital projects, like school construction. Rather than raise taxes substantially every time they need to build a new school only to lower taxes after its complete, the government sells bonds to finance the construction. Where the government is acquiring a long-term asset, like a school, debt seems like a reasonable funding mechanism. Lord knows state and local government fund a variety of dumb spending. But compared to what the Feds finance? The states look like a bastion of responsibility.

Bottom line. Debt isn't bad. In fact, I still think keeping the debt markets generally open is a reasonable goal of government during a panic. However, the idea that debt-financed consumption is something that should be encouraged is highly questionable.

Tuesday, December 08, 2009

Bernanke: She lied to us! Terminate her immediately!

Ben Bernanke told us yesterday that inflation "could move lower from here," obviously suggesting that any Fed tightening is a long way off. These comments got the market's attention, particularly after Friday's surprisingly benign jobs number.

However, I think Bernanke is essentially telling us that the Rebel base is on Dantooine. He doesn't really think inflation is likely to fall from here. Consider his actual words: "Inflation is affected by a number of crosscurrents. High rates of resource slack are contributing to a slowing in underlying wage and price trends..." What is he saying? Currently, we have too much excess capacity to produce. Should aggregate demand expand, firms will soak up some of the slack, but its a long way from being inflationary. Its a little Keynesian, but its probably correct given the extreme amount of slack we currently have.

But that line of thinking only holds if Friday's improvement in unemployment is a one-off. And it might be. But what if it isn't? Its fair to say that this number was hardly out of the blue if you consider the previous trend. The Non-Farm Payroll statistic has been steadily improving for several moneths. Additionally, consider all the data we've seen in the last three months or so. Almost universally its been pointing to a muted recovery, but a recovery none-the-less.

The Fed won't be able to justify zero interest rates if unemployment starts falling.

There are already plenty of hawks on the FOMC. So far they haven't actually dissented but I think that merely reflects a willingness to acquiesce for now given how fragile conditions are. Read the recent speeches from hawks like Plosser or Fisher. You'll hear a consistent theme. Yes, I think extreme measures are warranted... for now.

If we see resource utilization (including labor) improving, the hawks will no longer be willing to give in "for now." Because the "now" will be something totally different. I've said it several times. There is plenty of room between zero fed funds and tight money. 0.5% would still be accommodative. 1% would still be accommodative. Hell my Taylor Rule estimate says 2% is right, so even 1.75% would be somewhat accommodative!

Now consider the position in which Bernanke finds himself. We have to remember that the man can hardly just go out there and speak his mind. When he saw the actual jobs number, (whether or not that was before the rest of us) I'm sure he was as surprised as we were. I'm sure it occurred to him that this could be a game changer. But can he come out and say that? Of course not. What if it really is just a one-off and actual job improvement is a long way off? Publicly, Bernanke has to wait until he's much more certain before saying anything too definitive.

So he goes out and tells the world that inflation could fall further, implying that monetary policy will remain as is for an extended period. I just don't buy it. If Non-Farm Payrolls turn positive in the next 2-3 months, we'll get a fed funds hike by June.

Friday, December 04, 2009

Don't get technical with me! 12/4/2009

Well! -11,000? I didn't see that coming. And I think its a game changer. There is no way the Fed can keep rates at zero while unemployment is falling. I just can't see it. I'm also willing to go out on a limb and say that one jobs start turning positive, they will stay positive. This doesn't leave me expecting blow-out GDP or anything like that. Its still a tepid recovery. But I think 4% 10s are on our target screens now.

For what its worth, here's where Fed Funds futures are. Pricing about 50% chance of hike in June. I've got to admit that you have to apply some odds to a hike in April. Suddenly my Taylor Rule post doesn't seem so crazy!


Alright on to the technical picture. Last week we bounced pretty hard off the 3.20% area which now looks like a triple bottom.

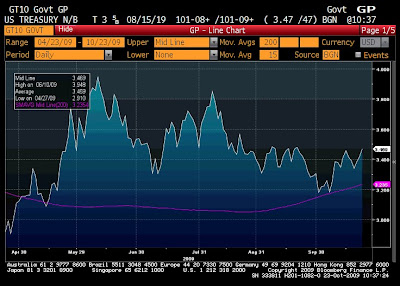
I also threw 3.48% on the chart (red line). Can't really say its a top since we broke it several times recently, but notice there's been a lot of work done right around that area. So I really wouldn't be surprised if we need to consolidate around this 3.48% area before we can push much higher in yields. Notice below that we're closing in on an over-sold area as well. (Note I'm using price of the old 10-year for this chart).


Once that happens I think its 3.71% then the recent high of 3.95%.

Meanwhile, back at Echo Base, check out the curve slope. This should be the real story when thinking about potential rate hikes. Strangely we're only 1bps flatter today. The 2-year should getting hit much harder than it is. Anyway here is a quick slope chart. Some people poo poo using resistance points with spreads but think about what the slope is. Its how much extra someone gets paid to go out the curve. Here it looks like when the spread hits about 265, investors start pushing out the curve...


Long-term I think the target might be +50 or zero, so this could be a huge play. How to play a flattener? You usually do something like short 10's and go long 2's and 30's in a certain proportion. Its a trade that often requires significant leverage and/or access to options on rate futures to really pull off. Our regular Joe readers ought to consider shorting mortgage REITs like Annaly Mortgage. They live for a steep curve.

Thursday, December 03, 2009

I told you it would work!

I've said it before and gotten all sorts of criticism, but the simple fact is that the Supervisory Capital Assessment Program, a.k.a. the bank stress tests, worked. Period. Bank of America's plan to repay the TARP is just more evidence proving this point.

You have to judge any endeavour on its own merit. That is, judge it on whether it achieved its goals. For example, its unfair to judge the Clone Wars cartoon series for what a moronic character Asoka is or for how Anakin doesn't seem to be a consistent character with the movies. Hell, I was watching with my 5-year old and at one point Yoda seems to imply that the clone troopers might be Force sensitive. Seriously? But its all OK, because my 5-year old loves it, and that's for whom the show is targeted.

Similarly, the SCAP was never meant to cure all that ailed the banking system. The purpose was to make it possible for banks to raise private capital. Before the SCAP, no one knew how much capital the big banks needed. Not just because of potential losses on balance sheet (which the SCAP did nothing to address), but because no one knew how regulators were going to react to those losses. No one had any idea that Fannie and Freddie were about to be nationalized and suddenly preferred and common shareholders were wiped out. Rhetoric was coming from all corners that banks needed to be nationalized as well, including from a certain Nobel-prize winning economist who many thought could be influential with the in-coming president.

Plus remember that the big banks were forced to take TARP money regardless of their financial conditions. What was stopping the government from simply declaring that it didn't like a certain bank's balance sheet and forcing it to take even more dilutive government investment? How could anyone invest in new bank common equity with such a high degree of uncertainty?

The only way to re-open access to private capital was to tell the market exactly how much capital the government thought a given bank needed. You knew that if the government said it was comfortable with a capital ratio of x, then investors didn't need to fear sudden nationalization if the capital ratio were actually x + 1. Sure, a bank could start out at x and then the situation deteriorates to x - 1 but that's the kind of thing analysts are comfortable with calculating. The whims of government? That's something else.

What happened after the SCAP? Investors knew that if bank losses were in the range of those projected by the tests, they didn't need to worry about dilution. Only about profitability. And with bank book values so low and the yield curve so steep, investors were willing to make that bet. Even with sketchy banks like Regions and Fifth Third.

Now is everything bright and bi-sun shiny in banking? Obviously not. I've written several times that I still think banks are quite vulnerable. But as a tax payer, I'm pretty happy to be getting out of banks. The alternative was much worse.

Thursday, November 19, 2009

Taylor Rule: There's nothing for me here now

We've been talking a lot about the Fed lately so I thought I'd share my version of the Taylor Rule calculation. I've built this myself so it might not exactly track other versions that are out there, but I did follow Taylor's basic methodology. Bear in mind that this isn't meant to predict Fed Funds. I use it more as a reality check. If my Taylor Rule calculation is falling I'm not likely to make a call that Fed Funds is going to be rising.

Anyway, here is a recent chart of the output. Taylor Rule in green, actual Fed Funds target in blue. I took it out to 4Q 2009 assuming that 4Q GDP and CPI comes in equal to Bloomberg's economist survey (3%).

Holy liquidity trap Batman! Its sharply negative, suggesting that monetary policy can't get easy enough. Thus it justifies the Fed's current stance.

Now consider what it looks like if I carry out the Bloomberg median survey result for both GDP and CPI through 2010.


Suddenly the "correct" Fed Funds level according to my model is 2%, by the first quarter! Will the Fed actually hike by 200bps between now and 1Q 2010? Even assuming that GDP comes in as expected in 1Q, I highly doubt the Fed gets this aggressive. But could they start hiking? I think its possible.

I think readers should consider the following:

  • Potential GDP is probably falling due to a less levered economy. That means a lower level of GDP would be considered above potential and thus potentially inflationary. It probably also means a higher level of NAIRU.
  • There is room to remain accommodative in policy but be above zero on Fed Funds target.
  • The fact that we're far below trend GDP levels doesn't matter. In a Keynesian world, its a question of whether Aggregate Demand is outpacing Aggregate Supply. What Aggregate Demand would have been in 2006 isn't relevant.
  • As a trade, if GDP does improve but the Fed doesn't hike at all, then it will be time to put on a bear steepener!

Monday, November 16, 2009

I warn you not to underestimate my power

A warning to all you exposed to the dollar carry trade, either directly or indirectly. A group which includes:

  • Anyone borrowing in USD to buy short-term assets in another currency.
  • Anyone borrowing short-term in USD to buy long-term USD assets, i.e., every U.S. bank.
  • Any U.S.-based company selling their product to non-USD consumers.
  • Anyone invested in a U.S. company who is borrowing short-term in USD and buying long-term assets and/or selling products in non-USD currencies. That is, anyone long U.S. stocks or U.S. corporate bonds.
  • Any U.S.-based investor long any non-USD asset, i.e. any investor in foreign stocks or bonds.

So basically anyone holding anything other than cash.

Below is the intra-day chart on USD/EUR.


What the hell happened at noon? Bernanke made a passing reference to the dollar. That's it. Here's the whole quote:
The foreign exchange value of the dollar has moved over a wide range during the past year or so. When financial stresses were most pronounced, a flight to the deepest and most liquid capital markets resulted in a marked increase in the dollar. More recently, as financial market functioning has improved and global economic activity has stabilized, these safe haven flows have abated, and the dollar has accordingly retraced its gains. The Federal Reserve will continue to monitor these developments closely. We are attentive to the implications of changes in the value of the dollar and will continue to formulate policy to guard against risks to our dual mandate to foster both maximum employment and price stability. Our commitment to our dual objectives, together with the underlying strengths of the U.S. economy, will help ensure that the dollar is strong and a source of global financial stability.
Now really, there is absolutely nothing there that suggests the Fed is going to do anything about the weak dollar. In fact, all he's doing is justifying the recent decline in the dollar. You can think what you want about why the dollar is weak or even whether its desirable or not. Bernanke doesn't care about the dollar.
And yet with this tiny nod to doing something about the dollar, the euro plummets. Just think about what's going to happen when the Fed actually hikes rates. There are so many dollar shorts out there. We will be looking at the mother of all short covering rallies. And the carry trade crowd is going to get absolutely crushed.
Will this happen this month? This quarter? This year? I don't know. How impactful will this event be on financial markets? I think it will be quite large, although whether that means S&P -10% or -20% or -30%, I'm not sure. I'm also not sure that we don't rise 10% between then and now and only correct back to where we are. I actually think 2-5 year bonds, including Treasuries, are the most exposed U.S. assets, not stocks, but we'll see.
Either way, I'd love to see the Fed make some kind of move, even if its hiking from 0% to 0.5%, to stem the tide of constant USD selling. The dollar weak crowd is too confident and all that confidence is what causes bubbles. Alas, I don't think its going to happen.

Friday, November 13, 2009

Don't get technical with me! 11/13/09

Yesterday's long bond auction was very interesting. I had been bearish going into it, went long some TBT, was feeling very good about myself until...

That my friends, is a bullish reversal. I've circled the auction time in red. The auction was a disaster, with almost a 5bps tail. I'm sure there have been worse long bond auctions, but not many. Anyway, the sell-off lasts for about 10 minutes before the short covering began. It took us all the way to the previous high on the day (yellow line) before tailing off slightly at the end. Still, quite a move.

Interestingly, the momentum chart has converged, producing a slightly bullish signal.


Otherwise I'm having a hard time seeing much in the charts. Looks range bound to me. In fact, I ran the tick-by-tick data on the old 10-year from September to now to see where the most trading has occurred.


42% of the trades have occurred between $101.2 and $101.9, which translates to roughly 3.48% and 3.39%. I had noted the 3.48% as a major support/resistance point in the past, so this graph validates something I'd been seeing in the chart. Anyway I highlighted in yellow the price we closed at today, meaning we're right there in the thickest part of the recent range.
I wanted to put on some 10-years today thinking we'd hit 3.48%, but we just didn't quite get there. I'm going to be patient and wait for us to get back to that level, then play it from the long side. I might be willing to leg into it at a level slightly below.

Tuesday, November 10, 2009

Fed on Employment: Well, forget the heavy equipment

The other day I speculated that the Fed was paying less attention to employment than most marketeers seem to think. Specifically, I question whether the Fed will wait for an outright drop in unemployment before tightening monetary policy, or if other factors will be viewed as more important.

Today we're getting four Fed speeches, which gives us a chance to see exactly how employment is characterized by the various Fed officials. So the following is the quote on employment from two of the four (Dallas Fed President Fisher doesn't speak until tonight, and Boston Fed President Eric Rosengren made no mention of employment in his speech on the Too Big to Fail problem.)

Atlanta Fed President Dennis Lockhart:

At this juncture, it's hard to be encouraged about a fast rebound in job growth. As you know, last week's employment report pushed the official unemployment rate to 10.2 percent, the highest since May 1983. Net job losses continue on a monthly basis but at a declining pace. Because employment growth tends to lag recovery from a recession and because of factors such as small business credit constraints, my current outlook for employment is one of very slow net job gains once the trend reverses, in all likelihood sometime next year.

If you believe in "very slow net job gains" even once we start getting gains, the unemployment rate isn't likely to fall at all for a long time. It could even rise if employment gains aren't enough to make up for new entrants into the workforce. Still, Lockhart acknowledges that employment lags.

San Francisco Fed President Janet Yellen:

The U.S. experienced so-called jobless recoveries following the previous two recessions in 1991 and 2001, when job creation remained weak for several years following the business cycle trough. In both cases, output growth was less robust than in the typical recovery and, unfortunately, things seem to be shaping up similarly this time around.

Less verbose, but could be construed as the same basic view. Weak job growth "for several years."

My question is, could the Fed hike to some number above zero even if unemployment is above 10%? Yellen and Lockhart are describing a situation where unemployment remains high for 2-3 years at least. What if at the end of 2011 unemployment is better, but still over 9%? I've got to think the Fed would have hiked.

Monday, November 09, 2009

Clumsy and Random Thoughts 11/9/2009

  • I know I didn't post a technical piece on Friday. I've been looking at the charts in my normal course of business and can't find any worthwhile patterns. Didn't want to bore you. I do think a short going into this week's auctions is a smart move. I don't think we can rally much beyond 3.44% whereas I think we can easily get into the 3.70's. In other words, good risk/reward.
  • Following that up, did you notice that the 10-year and 30-year auctions have been massively upsized? October's 10/30 auctions were $20 and $12 billion respectively. In November they will be $25 and $16. Ooo tee dee! And yet if the Treasury really wants to get to a 6-7 year average maturity for U.S. debt, these auctions are only going to get larger.
  • This is also the first set of auctions in the post QE (at least for Treasuries) world. Not that I think the lack of QE will show up in this auction per se, but let's watch.
  • Meet the new Kraft/Cadbury bid. Same as the old Kraft/Cadbury bid. KFT bonds moving tighter. Don't really agree with that move. I think this thing turning hostile is more uncertainty. Not less.
  • Back bid striking back in corporates. I'm short and frustrated.

Friday, November 06, 2009

Fed Rate Hikes: Your employment statistics. You will not need them.

On Wednesday I posted a poll on when the Fed would make its first hike. So far about half of the responses have been "After September 2010" with the other half being mostly between April and September.

Let's go over my view for what will drive the Fed's decision. If we look at the last Fed statement, the key new section is the following (its in the 3rd paragraph): "The Committee ... continues to anticipate that economic conditions, including low rates of resource utilization, subdued inflation trends, and stable inflation expectations, are likely to warrant exceptionally low levels of the federal funds rate for an extended period."

The bold section is new, and if taken at face value, it tells you exactly what the Fed considers the sign posts for higher rates. Inflation. Nothing else.

Notably absent is employment, home prices, the dollar and anything related to the carry trade.
If take the Fed at its word then you can't possibly expect any rate hike until the end of 2010 if not well into 2011. In other words, some time period far enough into the future to make it difficult to see. We have so much slack right now that it would take tremendous growth to close the gap. If you start where GDP was at the beginning of 2008 and assumed potential GDP was 3%, we're currently about 7.7% below potential. Hell, my version of the Taylor Rule says we need -3.13% Fed funds right now. The Fed doesn't have to wait for us to close that output gap entirely, but you aren't likely to see any inflation until it gets much closer to zero.

So the question is should we take the Fed at their word? Are they worried about employment and/or the carry trade? I don't know the answer. I'm going to be intently reading upcoming Fed speeches to see if these other factors are mentioned and in what context. I believe the Fed is going to be increasingly conscious of explaining their monetary stance. Take high unemployment. I'd expect this to get some play in most FOMC speeches, but it depends on the context. If the speaker explains why unemployment is a secondary concern to inflation, then I think we should likewise pay less attention to employment-related statistics.

I'm more worried about the carry trade and its potential for creating distortions. If those distortions are dealt with near-term, then I think the pain would be marginal. If we wait a year to do anything about it, then I'm very concerned. I don't think circumstances warrant a hike right now per se, but I want to see the Fed acknowledge the risk. And I need more than just Fisher and Plosser talking about it (by the way, neither are voting FOMC members currently). I want to hear everyone discuss the risk. They can't ignore the fact that excess money creation can flow places other than consumer goods, and therefore monetary stimulus can cause asset inflation.

For what its worth, I think the Fed considers bringing down their balance sheet as a bigger priority than altering rates. This is my impression from taking the mosaic of Fed interviews and speeches I've heard in the last couple months. That view reiterates the idea that short-term rates remain low for a long time, but it brings into question what happens to other assets, especially long-term Treasuries. The Fed bought 23.5% of Treasuries issued in 2009. In 2010, it is projected that the budget deficit will ease somewhat, but it will still be sharply negative. I think Treasury issuance rises. So with out the Fed buying, don't intermediate-term rates almost have to rise?

Wednesday, November 04, 2009

New Polls: Sounds like a dictatorship

I posted two new polls. One serious, one not so serious. We got horrible turnout on the last poll (Q: Best quote for the current stock market... most popular answer: "They've gone to plaid!"). First new poll is on when the Fed finally hikes. Just want to know your opinion on the very first hike.

Second poll is on the best pairing of a CNBC personality cast as a Star Wars character.

1) Charlie Gasparino as Greedo. High opinion of himself but ultimately not a very important character.

2) Rick Santelli as Salacious Crumb. Kind of funny but everything that comes out of his mouth is just noise.


3) Bob Passani as Moff Jerjerrod. Promised Darth Vader that the Second Death Star would be operational on schedule when he knew full well that he needed higher employment figures.


4) Mark Haines as Sio Bibble. Sour old man. Where are the chancellors ambassadors? Communication interruption must mean invasion! Bartiromo gets all the good interviews... blah blah blah...

Tuesday, November 03, 2009

Financial Regulation: How would you have it work?

Yesterday myself and several other financial bloggers got the chance to meet with several senior Treasury officials, including the Secretary himself. It was a fascinating experience and I have to admit, it was just plain cool to be within the bowels of power like that.

I am also on record as saying that Geithner was a good choice for Treasury secretary. We needed continuity as the bailout process was on-going. Geithner knew exactly where the bodies were buried in a way that other choices, such as Summers or Goolsbee wouldn't have. I have since come to view Geithner as a pragmatist, which I appreciate in anyone elected from the other party. And truth be told, a lot of the Treasury department's plans are working. I can't deny that. I panned the stress tests when they happened, but I can't deny that it worked. It created confidence where there was none. Say what you want about whether or not banks are still in trouble, I'm not terribly confident, but we're sure a lot better off today than January 19.

All that being said, I don't think much of the Administration's attempt at improving bank regulations, and I told them so. I even managed to do it politely without lacing in a Star Wars quote. Here is my main beef. I will explain myself in classic Accrued Interest style: very very long form.

The Administration's new regulatory scheme seems to focus on reducing bank risks. Higher capital requirements, more disclosures, etc. That all seems fine, except that is it really fundamentally different than what we have now? That is isn't it just an expansion of the same basic regulatory scheme that currently exists?

And if it isn't fundamentally different, does increased capital really solve anything? Citigroup had a large percentage of its risks off-balance sheet. Lehman's capital ratios were nominally quite strong on Friday, bankrupt on Monday. Both firms had adequate capital, and both either did or should have failed.

When this was pointed out to certain senior Treasury officials, their response was basically that they won't allow those sorts of games in the future. They were closing the loopholes that Lehman, Citi, and countless others exploited to hide their true leverage. I respond that even if you stop the games that banks were pulling in 2008, won't the banks come up with different games in the future?

The reality is that even if we do nothing, we might not have another financial crisis for many years. Let's say its 2022. Let's say we've just gone through 6 years of tranquility in the financial markets. Let's also say that banks have come up with some new and creative security where they get to keep all the upside with 85x leverage, but by the existing banking regulations it shows as a fully cash funded position against the bank's capital. Will bank regulators be motivated to ban this new security? I doubt it. Why do I doubt it? Because current regulators around the world looked the other way at CDO^2. Regulators aren't going to have the courage to challenge the banking industry during a period when the banking industry seems to have been right.

For the same reason I reject the notion of "regulatory supervision." Not to say that I think regulators are nefarious people, but are they going to understand the risks as well as the bank itself? And if the bank has a good reputation for taking risks, will regulators challenge them? Bear Stearns was known as the best mortgage shop on the street. Let's say you gave regulators dictatorial power, they could do anything they wanted. Would an omnipotent regulator have told Bear they were taking undue risks? Or would Bear have explained their positions, the regulator not understood them and assumed Bear was smart enough to handle it?

Transparency isn't a panacea either. Do you really think you are going to fully understand the risks at Goldman Sachs? As Yves Smith said yesterday, you'll never have Goldman revealing their trading book. And even if you did, it might not tell the whole story. By the time the disclosure, is published, their positions might be different. So what do you do? Put risks into categories? Like what? Credit ratings? We saw how well that worked! More transparency is better than less, but I'm asking the reader to be realistic about how much we're really going to know.

I'm a free market guy. I'd like to see any business be allowed to take whatever risks they can get funded. I don't want to tell what risks banks can take any more than I want to tell Macy's how many stores it should open or what flavor ice cream Coldstone should be selling.

Yes, I know. Coldstone isn't J.P. Morgan. But why not? Only because J.P. Morgan's failure has major consequences for other banks. But in a perfect world, we'd let J.P. take whatever risks it thought would make them money. That is, whatever risks the market would fund by buying J.P.'s debt and equity instruments. And if J.P. failed, then those investors would get burned.

Notice that this world wouldn't require regulators to predict where the next crisis would come from. It wouldn't even require banks to hide their leverage. The relative risk of a bank would be reflected in their cost of capital. If one bank was more aggressive than another, it would have to pay more for capital. I know, it sounds so idyllic, it can't be possible, right?

I argue that the only reason why it isn't possible is because we can't deal with a large bank (or insurance or brokerage) failure in isolation. There is always contagion. But there doesn't have to be. What if government regulation was aimed at limiting contagion post failure? It might be somewhat complicated and it might not completely eliminate all moral hazard, but its doable. Say that the government set up an FDIC-style insurance pool for over-the-counter derivatives and prime brokerage. Think of how radically different the AIG and Lehman failures would have been if no one was worried about having to face a bankrupt firm in a derivatives contract!

Like deposit insurance, I'd argue that such a regime wouldn't necessarily be costly to the government. Just like deposits, its likely that any firm's derivatives book could be sold to another firm, maybe at a loss, sure. It would be all the more easy so set up such a system if the more plain-vanilla derivatives, like interest rate swaps and most CDS were exchange-traded.

I know what you are thinking. Basically I'm saying to forget about preventative medicine and treat all patients only once they are in the ER. The problem is that regulation has done an absolutely horrendous job of preventing every crisis to date. Why do we think it will work this time? In fact, Yves Smith argued with me last night that the Basel II regulations, which are heavily credit rating oriented, helped to fuel the rise of the CDO. I agree completely. Where I disagree is the notion that a different regulatory scheme will somehow produce different results. I expect banks to do what they are incented to do.

We're seeing it already. Banks are loading up on Treasury bonds anticipating that those will get more favorable regulatory treatment in the future. Are we fueling a bubble in Treasuries? Maybe not, but the point is that regulation is inherently distortive. Replacing the old regs with new regs isn't going to change that simple fact.

So yes. I'd rather the government get out of the prevention business and get better at unwinding complex and systemically important financial institutions. It was really cool that I got the chance to tell Treasury just that. I don't know that its actually going to make a difference. But it was cool anyway.

Friday, October 30, 2009

Don't get technical with me! 10/30/09

I think whenever we are using technical analysis, we have to remember why it might work. Charts and patterns aren't some mystical energy field that controls the market's destiny. Its merely a means of gauging the market's mentality. Take a very simple indicator like the MACD, which is one I like a lot. All it basically shows is whether the 2 week moving average is lower or higher than the 1 month moving average. What does that tell you? Merely that price gains (or losses) are accelerating. In other words, is there momentum?

There is solid logic to the idea that stocks might follow a momentum-type pattern, that is that market participants won't all draw the same conclusion about a stock at the same time. Some will buy in early and some will buy in later. If IBM stock has positive momentum, maybe that means more and more people believe the company is executing on its strategy.

From a technical stand point, if positive momentum develops, that might be an indicator that some early adopters are buying the stock. You can buy in hoping that others will follow those early adopters.

This is a simple way of seeing how a chart can reveal something about how the fundamental side of the market is behaving. That is exactly where I think technicals can help one trade effectively. Often when I consider the fundamental picture, I can see good arguments on both sides. By using technicals, you can often find which argument is winning. This can help you better execute a fundamental view. If you want to be long, but see momentum building on the other side, perhaps its better to wait for another entry point.

One could say that technical analysis is trying to front-run fundamental investors. Momentum is one example, as illustrated above. Something like RSI is another. When a stock becomes over-bought, its logical to say that fundamental buyers may choose to take profits.

Where I think technical analysis breaks down is when it gets overly complicated and loses all connection with fundamentals. Elliot Waves, and seasonals are two that some immediately to mind. I roll my eyes whever I read something like "June and July have been good months for bonds 7 of the last 10 years."

Anyway, let's get to it. I've been touting 3.48% as a good support level for two weeks now, but it doesn't look as strong after having been broken materially.


In fact, it looks like a solid upward trend (in yield) has been formed. Here is the closing yield chart...


Looks like we need to hold around 3.45% to keep the trend in place. So 3.45% would be a good entry for a short, especially if we manage to close slightly higher than that today (in yield) today.

Here is the bar chart in price on the current 10s. I've tried to draw the lines between intra-day highs/lows (red) and the close high/lows (green).Confirms the yield chart, I think. And since I mentioned the MACD above, I figure I have to throw it in here. Momentum still sharply negative.


So I think you enter a short. If you want to be aggressive (which I am), do some at 3.45% if we hit it today, then add if we close at 3.46% or above. The stop would be if we close at 3.43% or lower yield, indicating that the trend might be broken.

Thursday, October 29, 2009

Look, I had everything under control until you lead us down here!

Credit trading got very ugly late last night. Sellers were showing up in force, buyers were all but extinct, the street was taking its reward and leaving. Here are a few sample quotes from traders describing the afternoon's trading conditions:

  • "Wheels coming off in finance spreads"
  • "Retail flows skewed 70% to the sell side"
  • "We're testing the liquidity thesis"
  • "Liquidity non-existent"
  • "Market clearing spread levels uncertain as sellers unable to find buyers"

Is this a inflection point? Are spreads headed wider? I'd like to think so. My models are pointing as bearish as they've been all year and I've thus moved into a bearish credit stance. However I have to admit, we've been here before. Several times over the last 6-months we've suffered through a day or two of real ugliness only to snap back. The real money back bid has (so far) always been there.

This morning it looks like the back bid is showing up again. Overnight I'm hearing credit traded well in Europe and bank spreads are opening 3-5 tighter.

The thing is, credit spreads are in a very precarious position, especially high-grade spreads. The carry trade has been a key driving force of the spread rally. Its not the only positive force, we have had some real economic improvement since last winter, but clearly ultra-easy money has helped to fuel demand for spread product.

So now which path do we start down? If economic data starts coming in stronger, if job losses abate and consumer spending keeps increasing, then the Fed will hike rates. That will be negative for spreads. If economic data comes in weaker, then maybe the Fed stays accomodative, but fundamentally spreads would probably start moving wider.

Admittedly, always in motion the future is. But how can credit spreads move much tighter near-term? Difficult to say.

Wednesday, October 28, 2009

A useless gesture, no matter what technical data they've obtained!

In my last 10-year trading post, I wrote that while momentum was negative for Treasury prices, we were sitting on a key support level, leaving the direction highly uncertain.

On Monday, 10's pushed through support at 3.48%, offering an entry for a short. I made a small short at 3.50% using TBT ($47.24). I was at 1/3 size. I figured I'd pile on if the 2-year auction stunk. I looked like a genius for about 4 hours. Then on Tuesday we rallied away most of my gain and the strong 2-year auction pushed the 10-year back through the 3.48% level. I sold TBT within seconds of the auction at $47.21.

Now we're extending the rally with 10s at 3.41%. If I were forced to pick a direction I'd guess we keep rallying into the low 3.30's, but of course the 5 and 7-year auctions could go poorly and completely upset that. My plan is currently to let it keep rallying and then re-set a short, most likely in front of the 3-10-30 auction cycle next week. I might fool around with trading right around the auctions today as well, but those will be very small sizes if I do it at all.

Tuesday, October 27, 2009

Too Big to Fail: Cut the chatter Red Two!

Yesterday's report on CNBC is that Congress is nearing a bill on new financial regulations aimed at the Too Big to Fail problem. The details are vague, but the crux of it is that the government wants the power to wind down failing financial institutions much in the same way the FDIC has the power to unwind failing commercial banks.

(FYI, very nice piece over at Economics of Contempt on TBTF, which I recommend. I'm not going to cover much of the same territory here, but he makes a lot of great points.)

Here are my basic concerns. First, we cannot wind up with a banking regulatory scheme that focuses on hard targets for anything. Systemic importance can't be measured just by assets. State Street and SLM Corp have about the same asset level, but the former is much more systemically important than the later. Or what about a firm like Ambac? Ambac's asset level peaked at only $24 billion, but certainly it had more systemic importance than its size suggested. I'm not sure it would rise to the level of Too Big to Fail or not, but I think we'd all agree that while size may matter, it isn't everything.

Not only is there no single number for systemic importance, there also isn't any single calculation that will measure effective risk a financial firm is taking. We know in the recent crisis that Citigroup had all sorts of off-balance sheet risks. As of 2007, Citi had a Tier 1 ratio of 7.1, but its effective leverage was much higher than that.

And its not all about leverage either. Look at Lehman. They had a Tier 1 ratio of 11 just weeks before they were bankrupt. Their problem was part their funding mix which was very reliant on repo and prime brokerage, and part the fact that the market didn't believe their valuations on some illiquid assets. Maybe had either of those circumstances been different, i.e, the same leverage and assets but a more stable funding mix, they would have survived. Regardless, a regulator scheme based on leverage ratios never would have caught Lehman before it was too late. Nominally, they had plenty of capital.

We also don't want a scheme which is overly focused on routing out bad lending. I say this because I have as much confidence in regulators judging loan quality as I do Chancellor Valorum. In fact, my suspicion is that regulators will likely spend most of their time fighting past wars. So if we assume that there will be another period where lending standards become dangerously weak (which there will be), we should also assume that regulators won't be able to foresee the problems and stop them before they start. Put another way, there will be spilled jawa juice. You can't prevent it. We need to be able to clean up the mess a lot better than we did this time around.

One of the problems we had this time around was that for a long while there was very little differentiation between bad banks and not-so-bad banks. For example, if we go back to November of last year, a bank like M&T Bank would have had a very hard time raising fresh equity capital. Did M&T make some lending mistakes? Sure. But by being completely shut out of the equity market, didn't that basically make M&T no different than a bank like National City? Or even better, could Wells Fargo had realistically sold new equity in February when every one was talking nationalization? Again, did Wells make some lending mistakes? Absolutely. But is it healthy for the system for banks to be viewed as so black and white? Back then it was good or bad. Whereas in reality, every bank was grey.

Let's take it as a given, just for a moment, that M&T Bank had an above-average quality portfolio. I'm just using them as an example, I don't really know M&T's portfolio that well. Why did they have so poor access to the capital markets? The stock market presumed that all banks would need to raise capital or else they would be driven under (or nationalized) by regulators. So bank stock prices kept falling and falling, making any realistic capital raise harder and harder. No one benefited from this self-fulfilling prophesy.

This example illustrates that we don't want a system that forces access to the capital markets as a pre-condition to survival. The stock market will run ahead of the potential capital raise, making it more and more painful. In fact, one could argue that's what happened with Lehman. The falling stock price basically dared Dick Fuld to try to gut it out without any additional capital. Again, no one benefited from this scheme.

This is why the idea of contingent capital makes so much sense to me. A bank has a ready set of equity investors whenever its needed. It instills market discipline, as the current stock price would reflect the potential for dilution, but the falling stock price wouldn't prevent a capital raise. In effect, this is a little like a standard bankruptcy, where bond holders take control of a company, except that instead of the company actually going through such a disruptive process, ownership just transfers (in part) to the contingent capital bondholders automatically.

We'll undoubtedly spend a lot of time on this subject in the coming weeks and months and I'm sure it will feel very much like a moving target. I can't wait.

Monday, October 26, 2009

Bonds and the U.S. Dollar: Use the commlink? Oh. I forgot. I turned it off.

Call me a sucker for the classics. Be it the original trilogy, the old Kenner figures, the "Nyub Nyub" song at the end of Jedi, or the classic theories of exchange rates. While the old classics, like interest rate parity or purchasing power parity, may not exactly fit reality (especially not in real time), I think the concepts remain useful. That is to say that as inflation rises, a nation's currency should depreciate. As interest rates fall, suggesting that there are few good local investment opportunities, the currency should similarly depreciate.

I wrote several weeks ago that the dollar should depreciate for exactly those reasons (I even made the same classics joke). The U.S. should have higher relative inflation vs. other countries, and the Fed would likely hold U.S. short-term rates lower than other countries.

A corollary to the above discussion would suggest that bond yields should normally be inverse correlated to the dollar. If the dollar is falling because inflation is rising, that should also be reflected in higher bond yields.

Or if you want to make a deficit-based argument for a weaker dollar, to which I don't ascribe, but either way, it would still suggest that weaker dollar = higher bond yields. If the deficit is causing a flight from U.S. assets, then Treasury prices should fall as money flows out of the U.S.

Indeed, that is exactly the pattern you saw for the first half of this year.


Lower dollar coincided with higher bond yields. Exactly what we'd expect.

But then a funny thing happened on the way back to normal. Like Zam Wessel, The dollar/bond relationship went completely the other way.


What's going on here? The dollar gets weaker, bond yields fall?

It traces back to why the dollar is falling. Unfortunately we're going to have to get away from the classics and consider what's going on right now. Right now, the U.S. is the cheapest place to borrow money anywhere in the world. If you are a non-dollar entity, whether you are a government, central bank, insurance company, etc., your cheapest source of funds is anything U.S. LIBOR-based. You can borrow in dollars and re-invest in something local to you. That's dollars flowing out of the U.S., thus pushing the dollar weaker.

Meanwhile if you are a U.S.-based investor, your cheapest source of funding is still something U.S. LIBOR-based. Remember that banks are still sitting on huge deposit bases and are either unwilling to lend or unable to find worthy borrowers who want credit. What do they do with their deposit base? Invest it in bonds! If your borrowing cost from the Fed is 0.12% (approximately where Fed Funds is trading), you can buy 2-year notes at 1% and make tremendous carry. Just take a gander at the recent bank earnings. The NIM's are huge.

When is the Fed going to take away the bowl of Aunt Beru's famous blue milky looking punch? According to a recent story from the Financial Times, maybe sooner than we think. I had long thought that a Fed hike was a long way away but as consumer spending starts rising, the risk of inflation returns. Now it seems like some number other than zero is probably the appropriate funds rate.

Plus it would be nice to think that the Fed realizes how zero Fed Funds is impacting financial markets and the potential, potential mind you, for it to create dangerous distortions. Whether they actually do realize this or not is any one's guess.

Friday, October 23, 2009

Don't get technical with me! 10/23/09

Say what you want to about next week, it will be interesting.

To start off, momentum remains solidly negative, although the bars show declining intra-day vol recently.


The 10-year is sitting on what I think is strong support at 3.48%.

Next week we get a ton of new auction supply. $7 billion in 5-year TIPS on Monday, $44 billion in 2-years on Tuesday, $41 billion in 5-years on Wednesday and $31 billion 7-years on Thursday.

I predict the auction results will be weak, especially for the 5 and 7-year bonds. Lately how well auctions have gone as been a function of whether foreign demand shows up in force or not. This isn't a comment about the long-term foreign demand for U.S. debt. Rather an observation that central bank demand in particular is notoriously fitful. They need bonds one week, they don't the next.

Last week saw very heavy buying from east Asia and Russia. I am willing to bet that will mean less demand at next week's auctions. In particular the 7-year, since I heard that was where they were buying.

Auctions don't guarantee lower bond prices. Here is a chart from the last 2-week Treasury auction binge (9/22-10/8). Yields basically moved straight down for the first week (the 2-5-7 year cycle) then were sideways for the second week (the 30-year was especially poor).

So one could make a case for a long here, maybe a good 2-year auction allows us to bounce off support at 3.48%. I'd think the next resistance would be around 3.30%, which is a level we've hit several times and also about equal to the 200D SMA.


So what's the play? I don't like an outright short right now. Especially given today's action. Sharply lower stock market with a lower Treasury market? Sets up for a big rally given even a modestly good auction. I view days like today as having latent Treasury demand.

Better to play this contrarion. Wait to see how the 2-year goes. If it goes well, look for an entry for a short and play it back to 3.48%. That would require a very tight stop. Or if it goes poorly as we break through 3.48%, then you ride that up to 3.71%, where I think the next resistance point is.

The other play is buy TIPS ahead of Monday's auction. Word on the street is that the primaries are begging the Treasury to issue more TIPS, but instead the Treasury decreased the size of the 5-year auction! I'm buying TIP here at $103.20 with a target of $104.28, stop at $102.85

Thursday, October 22, 2009

Bank Loss Reserves: Not an easy challenge

With most of the big banks having reported 3Q earnings I wanted to take a look at how we're progressing with loss reserves. Unfortunately, I did not find good news.


Here's what I did. I took a look at Wells Fargo, J.P. Morgan and Bank of America. All three reported a decent breakdown of their loan exposures by type. (Click on each name above for their earnings presentation). I then took the loan loss estimates used by the Fed in the stress test and multiplied each bank's exposures by the loss estimates. Note that the Fed basically had four loss estimates. They had a "Baseline" and a "Adverse" scenario, then they had a high and a low estimate within each of those.


Then I compared that loss estimate with the combined loan loss reserve and current write-downs the bank has taken. This analysis is far from perfect. Each bank reports things a little differently, so I had to make some judgements. Plus who really knows whether the Fed's SCAP estimates for loan losses are right. Still, the Fed's guess is as good as any, and the exercise should be illustrative of how close we are to the end of loan loss provisioning.


Alright, so on the left is estimated losses in all four scenarios, the bottom two blue bars being the "Baseline" and the top two being the "Adverse." Then on the right is losses realized/provisioned to date.


First, Wells Fargo.


Ugh. Almost enough to cover the range of "Baseline" losses, but we should keep in mind, the baseline assumed unemployment would average 8.8% in 2010. Its currently 9.8%. The adverse assumed 2010 unemployment of 10.3%. Given that unemployment is almost assured to go higher before it falls, I'd be shocked if the number weren't closer to 10.3% than 8.8%. Not that loan losses couldn't possibly outperform the unemployment rate if you will, but I'd consider the red area more likely than the blue area.


Moving on to Bank of America.


About the same, although the mix of loans makes the distribution of blue and red a little different. Regardless, a long way to go here.


Now J.P. Morgan.


A little better. Jamie Dimon has more than the Baseline SCAP loss estimate covered. Still, you'd think there are more losses coming here.


So comparing the three, I ran the losses already accounted as a percentage of the Baseline Low and Adverse High (in other words, the lowest and highest loss estimates in the SCAP) for each bank. Below is that chart.

Ugh again. At least with J.P. Morgan I can squint my eyes real hard and suppose that they might be getting close, especially given J.P.'s relatively small commercial loan book. But looking at Wells Fargo and Bank of America, these are still banks that are going to struggle to keep up with losses as far as I can see.


Now consider this. Bank of America 2014 bonds are +210, Wells Fargo +150, J.P. Morgan +140. Shouldn't Wells and BofA be a lot closer? Shouldn't there be a bigger gap between Wells and JPM?

Tuesday, October 20, 2009

Clumsy and Random Thoughts 10/20/09

  • In Friday's post on my 10-year trades, I got some great feedback. Keep it coming. I neglected to mention what my price goal and where my stop would be. I think if we push through 3.48%, the next significant support point is 3.71%. So that's my price target. I'll of course be watching the patterns developing in the interim.
  • As for a stop out, I'm dangerously close already at 3.37%. I'm comfortable with the fact that I may take several small losses before I finally hit my big gain. I think that's part of trading.
  • One commenter specifically suggested that I should have waited for an actual breech of 3.48% before taking on a short. That's an extremely fair criticism. That would be the classic way to play the trade I described. I was being a little more aggressive due to my view that negative momentum had already been established. If I get stopped out, clearly it will look like I was a bit too aggressive.
  • If I am stopped out, I'll be looking to reset the short, not set a long. I don't like to trade against my fundamental view, which currently is bearish. So I'll most likely either be short or nothing in the near-term. Next week's new auctions could provide an opening for another short.
  • Last week I also suggested munis would likely stabilize. Indeed last week's backup is now looking like a correction rather than the start of something more serious. I've been hearing that the supply over-hang on syndicate desks has been reduced considerably.
  • However, something to watch. According to AMG, muni fund flows fell to $615 million last week, vs. a $1.8 billion the previous week. Weekly flows had been running in the $1.5 billion range pretty consistently for the last couple months.

Friday, October 16, 2009

Don't get technical with me! 10/16/09

I've decided to start a new regular segment on Accrued Interest doing technical analysis of the 10-year Treasury. I'm planning on doing this about weekly, although I won't swear it will always be on the same day.

This will be something of a departure for this blog, since classically I've rarely talked about trades I'm actually doing and even more rarely talked about short term trades I'm actually doing. But here is why I'm doing it. I think that going forward, there will be more money to be made trading bonds with a short-term view. I believe volatility will be permanently higher than in the recent past, and the ability to discern short-term movements will be the key to making money. I'd like to think opening up a discussion will help readers make more profitable trades.

The other reason is purely selfish. It is my long-term goal to start my own hedge fund. It wouldn't really be for the money, more because I think that's how I'm wired. If I could be running my own hedge fund but my income was only 75% of what it is now, I'd make that trade in a second. Anyway, although this eventual move may be a few years away, I've already built many of the models I plan to use as part of my trading strategy. Treasury technicals isn't a model per se but it would be part of my trading strategy. The models are proprietary, but technicals aren't. And besides, by sharing my strategies, I hope to get feedback from readers to perhaps improve my results.

So let's get to it. You may remember last week I showed a chart suggesting that yields on 10s ought to fall. Didn't happen, so let's review what actually did. Below is a similar chart to the one from last week updated to now.


Note this is a yield chart, so downward moves are bullish. The yellow line is a 200D SMA, the red and green were trend lines I drew. At the time, the red and green seemed to suggest to me a pattern of lower lows and higher highs. But now it looks like a wedge. It bounced off the SMA, broke above the trend line and would seem to be headed higher in yield, lower in price.

The above is a 30D intra-day price chart for the current 10-year. You can see the gap downward on 10/9, 10/12 was a holiday, 10/13 we filled most of the gap, and then started moving lower again.

Looking at a plan vanilla MACD chart, short-term momentum is clearly bearish.


So the trade looks like a short. What's the entry? Seems like there is resistance at 3.48%. This bar chart (with Fibs) shows there has been a lot of work done right around the current price level (this is a price chart, I know, price/yield gets confusing. You'll get used to it.) I've circled the price area of approximately 101-3 to 101-16, where we see lots of action in early-mid September. That corresponds to about a 3.45-3.48% yield. Right where we are now.


Note that bond guys didn't seem to give a shit about the 50% re-trace from the highs. I know a lot of bond guys follow Fibonacci re-traces, but I honestly haven't been able to make it work for me all too often. Don't be fooled by the fact that 3.48% is very near the 38.2% line, because when all those trades were happening, it wasn't the 38.2% line! Only once we hit the high on 10/2 did that become the number.

3.48% is backed up by this intra-day yield chart. The yellow line is 3.48%.


After doing all this, my play is to leg into a short in three parts. First I've put on some right now. Second I may get the chance to put on more at about 101-24, or 3.41%,. Again, looking at the intra-day, that looks like an area of high-volume that we could revisit on a bounce off the 3.48% resistance. Then I'd add a third chunk once we breach that resistance in a meaningful way, maybe 3.50%.

Thursday, October 15, 2009

J.P. Morgan vs. Citigroup: Boy, it's lucky you had these compartments

Here is my take on bank earnings reports. I'm coming at this from a bond guy's perspective, so I'm a little less worried about whether certain revenues are recurring or not. By this I mean, JP's fixed income trading revenues were probably higher than what we can realistically expect in the future. That being said, JP will probably have robust trading revenues in future quarters, just maybe not this robust. Same with the elevated NIM. Remember, bond guys don't care whether EPS is $1.5 or $1.55/share. We care about ticking time bombs.

So I'm more interested in whether banks are working through their problems. We know it will be a while before loan losses start falling, but at some point, banks will have actually provisioned enough. I don't think we're there now, nor do I think we'll be there in the next couple quarters. So what I want to see banks doing is using this period of elevated NIM/trading gains to build reserves against future.

What I don't want to see is banks using the recent slowing in consumer delinquency growth (note I said slower growth) to project lower loan losses in the future, and thus manipulate earnings higher. That's just not an honest assessment of the situation, as far as I'm concerned. Yes, maybe delinquencies are slowing, but losses are still growing. There is no way around that.

Witness the difference between J.P. Morgan's report yesterday and Citigroup's today.

Here is JP's summary of their consumer loan portfolio. First home lending: (circles were in the original).

Home equity portfolio looks improved, but weakness everywhere else. Then there is credit cards. Same story.


Alright, so not some kind of disaster, but clearly loan losses continue.

Now here is Citi's home lending portion of their presentation.

Same story right? 2nd Mortgages would include Home Equity, so maybe some improvement there, but on first mortgages, problems continue, actually seem to be accelerating.

On commercial, Citi didn't break out commercial loan performance in their presentation, and J.P.'s doesn't show much change. Probably just reflects the fact that commercial losses are coming whereas residential losses are here.

So what did both companies do with this information? J.P. increased consumer loan loss reserves by $2 billion to 4.6% despite the fact that overall charge-offs declined. Citi only increases loan loss reserves by $800 million to 6.4% of all loans. The ratio of loss allowance to charge-offs is 1.2x for J.P. Morgan, its 1.1x for Citigroup.

This all bothers me. It seems to me that the trends are weaker for Citi but they are taking less in loan loss provisions when compared to their charge-offs.

Maybe I'm making too much of this. But I can tell you this. I own JPM bonds. I don't own Citi.

Citi vs. JP Morgan: I don't know what you're talking about

Probably don't.

I'm going to go through a more in-depth study of this, but at first glance, I don't like Citi's report at all. I don't mind gains driven by mark-ups. Some level of mark-up is legitimate this quarter. But a decrease in loan loss provision? A day after J.P. Morgan increased their provision? This reeks of earnings management.

I'll post more thoughts as I get through the report, but I welcome your comments.

Wednesday, October 14, 2009

Municipal Bonds: As clumsy as it is stupid

Municipal bonds are getting crushed again today. 10-year MMD was cut 13bps today after being cut 11bps yesterday. That's something like -2 points in price losses in two days. Closed-end funds are getting absolutely crushed. Traders I've talked to are blaming street selling. Here's what's been happening.

For weeks, the bid for munis seemed endless. Even as the ratio with Treasury bonds hit historic low levels, (75% on 10's) mutual fund flows were so strong and new issuance was so light that dealers couldn't keep bonds in stock. So they bid every competitive deal like a Correlian smuggler hitting on an Alderaanian princess.

Then all of a sudden the street found the level at which people just wouldn't buy. I'm not sure if fund flows have tapered off or if its just a buyers strike, but my bet is on the former. Now dealers are stuck with bonds in syndicate. If you are a dealer like Stone & Youngberg or R.W. Baird or Loop Capital (i.e., the regionals who are mainstays of the muni market) getting stuck with $20 million bonds really does matter to you. That's real capital that isn't making you any money. In fact, if you have to cheapen up your offering, it costs you money. You're taking losses on those bonds.

In other muni news, today we got two interesting BAB deals. The Crimson Tide vs. the Minutemen. Wouldn't be much of a match on the football field, and wasn't much of a match in the muni market either. University of Alabama brought a 2039 maturity (among others) with initial talk in the +220 area (that's 2.2% above 30-year Treasuries in yield). UMASS was talking +225 for the same maturity. 'Bama is rated Aa3/AA- while UMASS is rated Aa3/A+. Not really any difference.

Citigroup struggled to sell UMASS, even cheapening it up by 10bps. As I'm writing this, I don't believe the deal is done yet, after two days of selling it. Meanwhile Morgan Keegan had a food fight on their hands. Investors clamored for 'Bama, causing Keegan to tighten the bonds by 15bps. Many times over-subscribed.

So in the final analysis UMASS had to pay at least 30bps more in yield to sell their bond compared to University of Alabama. Why? Because no one trusts Massachusetts' budget. Note to politicians around the country. Your actions have consequences. That's real money UMASS is going to pay to bond holders instead of using it for education.

Finally, I heard today that the Nuveen Insured Dividend Advantage Fund (closed end) is selling $100 million of $10 par preferreds. This is intended to replace some of their existing auction-rate preferred bonds which have been stuck in limbo for nearly two years. Worth noting that its structured as fixed rate at 3% for 5-years (tax-exempt) with a premium call after 1-year. That's a hell of a rate! To my knowledge, CEF's never have sold fixed-rate preferred stock to fund their leverage in the past. It creates some risk that investment rates will fall below their leverage cost, but then again, they can call the damn things if they have to. If rates rise this thing would be a boon for the Nuveen fund. Look for all the closed-end funds to follow suit.

I think munis will come back, at least vs. Treasuries. We're now at a somewhat cheap 90% ratio on 10yr munis. I don't think anything has fundamentally changed and I don't think this sell-off has anything to do with credit fears. Problem is that it might be Treasury rates rising that gets the ratio back to 85% or so. Either way, I'm not going to jump in front of the train!

Disclosure: Bought the 'Bama bonds