Last week I wrote about my disdain for the Payrolls statistic. Basically I argued that its always been a lagging indicator so why does it result in such a large market reaction? There were some interesting comments that I want to follow-up on. One commenter suggested that "every job lost is another mortgage in jeopardy..." I responded that the data doesn't support this, that delinquencies are leveling out. Another commenter (maybe the same one, it was anonymous) said, "Delinquencies are slowing? I don't see it." then posted this chart: (source = St. Louis Fed: http://research.stlouisfed.org/fred2/series/NPTLTL?cid=93)

Obviously the chart above is what it is, and certainly doesn't show any leveling off. However, it isn't consumer specific, and the commenter's argument was about consumer loans. I thought I'd share how I track consumer loans. I use a sampling of securitized mortgages and credit cards. This isn't perfect. First I'm taking a sampling which always has risks. Second, there is probably a bias to loans that have been securitized. Most likely securitized loans are somewhat worse than loans held on balance sheet by the same bank. It is also likely that there is some bias by what types of loans fit into securitized pools, what kinds of structures investors demanded, etc.
However, the advantage is that the data is available much quicker than other sources. So the above chart from the St. Louis Fed is only updated to 2Q, I have data up to August, and in two weeks I'll have September. Plus I can limit my sampling to certain vintages. In particular I look most closely at 2006 and 2007 vintages for mortgages.
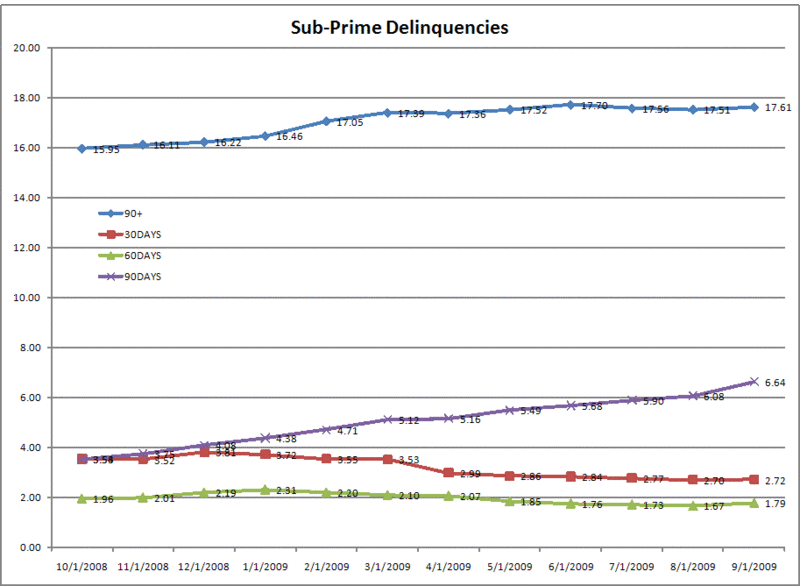
Anyway, here is my data. First sub-prime home equity (comparable to the ABX).
I've got four lines. The 30, 60, and 90 are unique sets, where as 90+ includes everything from 3-months late to foreclosed. So I think that's the most interesting set. There is obviously a leveling out here. Obviously if we took the time series back a year or two, you'd see a huge ramp up. Note that the 90 day bucket keeps rising (despite falling 30's and 60's) and that tells you that once a mortgage goes delinquent, it just keeps moving through to foreclosure.
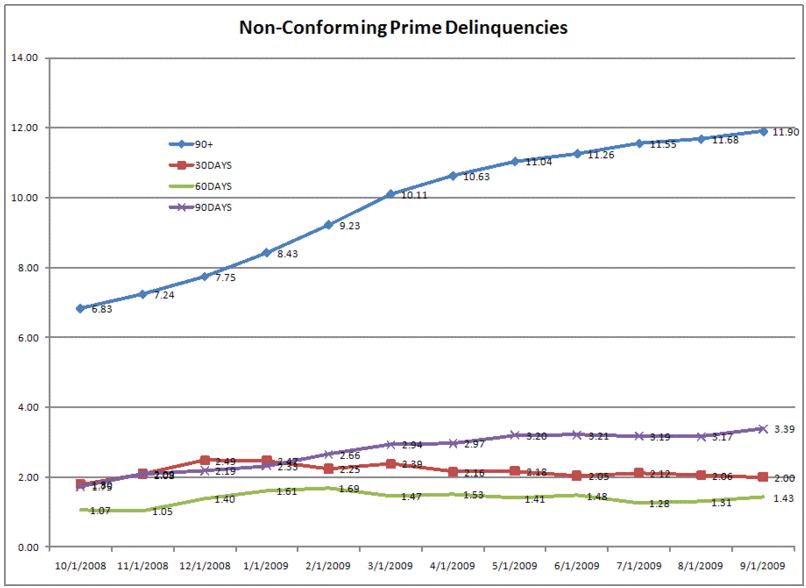
Then non-conforming prime mortgages. Remember these are mostly stuff like Option ARMs, low docs, and/or other creative financings. Again, its my own sampling of RMBS deals from 2006 and 2007, so it won't necessarily match up with any other statistics out there.
That's still rising, but again, at a much slower pace compared with last year. I think both of these are consistent with a burning out of the bad lending that was going on in 2006-2007.
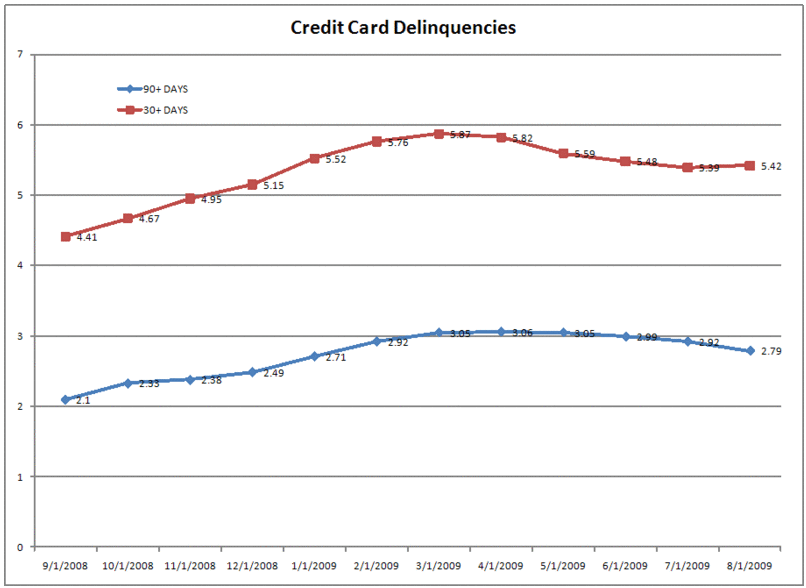
Finally I have credit cards. These are a little different than mortgage securitizations because the lending period tends to be so short. So here I've ignored vintage and just gone with the master trust data. Note also that this shows 30+ whereas the other charts had 30 day delinquencies as a unique bucket.
Here is my point. All is not right with the world. Banks are still struggling with bad consumer loans. Commercial loan problems are just now beginning. However to suggest that unemployment is a key driver of recent delinquencies just doesn't fit the data. Delinquencies are leveling out just as unemployment is ramping up. Of course, when people lose their jobs it certain has a negative effect on their ability to service debt. So I think the correct way to think about this is that we really have two waves of consumer loan losses. The first is related to bad lending. These are burning out now and won't be a problem on the margins going forward.
The second is old-fashioned recession style delinquencies. The reasonably structured loan that goes bad because someone lost their job. Obviously those will be increasing with unemployment. But I suspect that losses related to bad lending will dwarf those from this second wave of delinquencies related to unemployment.
In terms of a macro-economic view, I think the consequences of all this are more negative for banks than for consumer spending. Although I'm not terribly bullish on consumer spending, I do think consumers keep consuming at some reasonable pace. The people with jobs will keep spending, and the people who lose their jobs will resume spending once they find work. However even if consumer lending losses are leveling off here, they are still very high, and commercial lending problems are just now coming to fore.


13 comments:
No argument with your methods or points, but could you post your graphs as larger images?
You could keep the smaller ones inline, with a link to larger ones. I'm not intending to use them for anything, just like to see the graphs clearly.
Thanks.
Try it now. Should be able to click the picture and see a much larger image.
"But I suspect that losses related to bad lending will dwarf those from this second wave of delinquencies related to unemployment."
I totally agree with the statement above. There's two distinct concepts at play: one is delinquencies and other other is loan loss. A delinquency doesn't necessary lead to a loan loss. Conceptually, the LTV must be than 100% for a loan loss to occur.
A delinquency related to an unemployment trigger - can occur in a housing area with a low decline in real estate values and/or on a seasoned loan with a low LTV. In both cases, there's equity remaining. The loan can be restructured/modified or even the house could be sold, and no loan loss is incurred by the lender.
"Most likely securitized loans are somewhat worse than loans held on balance sheet by the same bank. "
Unless you are talking about new loans made with "corrected" underwriting standards, this is not so. What remained on the balance sheet were the loans which were kicked out the deal by ratings agencies (because including it would have reduced diversity), special servicers (specific to CMBS) and the GSEs who were targeted to buy a specific bond. Underwriters employed entire teams to filter out loans so that the pool would look good to the ratings agency models.
One issue with using unemployment is a proxy to anything is an underlying assumption that job losses are spread evenly. Where my intuition tells me that we might have lost 5% of the employment base, but much less so in terms of salaried Income, i.e. there majority of the losses, especially more recently were jobs paying below the avg pay.
@ Mike
"Most likely securitized loans are somewhat worse than loans held on balance sheet by the same bank. "
This really depends on the "bank". Many small community and regional banks would not make a loan unless it could sell it. If they had a questionable loan, they would determine it they could sell it or securitize it. If they couldn't they'd never make the loan.
Of course, this wasn't true of the large aggregating banks like WAMU, but it was certainly true for many small community and regional banks.
your methods of calculating delinquency rates appear suspect. what are you sampling?
according the federal reserve, delinquency rates have been surging.
http://www.calculatedriskblog.com/2009/08/fed-delinquency-rates-surged-in-q2-2009.html
I appreciate your diligence in trying to stay objective about this issue.
Somewhere deep in the bowels of the BofA, WFC, and JPM financial statements there is a lot of shadow inventory of deliquencies and a slew of foreclosures that is not being reported. I am not sure how they do their accounting magic, but I am confident it is there.
Ravi:
If you look at my charts vs. the Feds you'll see nothing "suspect." The Fed chart shows about 9% delinquent for residential. I'm showing about 18% for sub-prime and 12% for prime. Now my chart is only the last 12-months, so you don't see this huge ramp-up, but that's just a matter of scaling.
Like I said, all I did was focus on 2006-2007 vintages and picked the largest deals.
As far as credit cards, all I can tell you is that I'm using the master trust data. There's no sampling.
One thing to keep in mind is that some of the loan products haven't hit their reset dates when borrowers actually have to make principal payments (pay-option ARMS generally act as IO loans for the first 5 years after origination; 5/1 IO and 7/1 IO loans were also popular products). These were originated in large numbers starting in early 2005 through early 2007. Consequently, we're likely to see a pickup in dqs as we go through 2010 and 2011, especially since 70-80% of pay-option borrowers only make the minimum payment (which is actually below the IO payment). There are no refi options for most of these loans - they are way underwater due to reduced prop value and, in the case of pay-options, the negative amortization. Also, the on-balance sheet loans of similar product types are unlikely to be performing better than securitized loans for the reasons discussed in the other comments.
Thank you for sharing. I'll keep on visiting your blog.
There is often a service charge involved for the drafting of cashier's cheques in addition to the amount that the cheque is for, though some banks waive this fee for individuals that hold an account with that bank. for more information about Cheque Loans
visit
http://www.chequeloans.org.uk/
There is often a service charge involved for the drafting of cashier's cheques in addition to the amount that the cheque is for, though some banks waive this fee for individuals that hold an account with that bank. for more information about Cheque Loans
visit
http://www.chequeloans.org.uk/
Post a Comment